What We Deliver
For each tailings pond, TSF, or process water cell survey, the package includes:
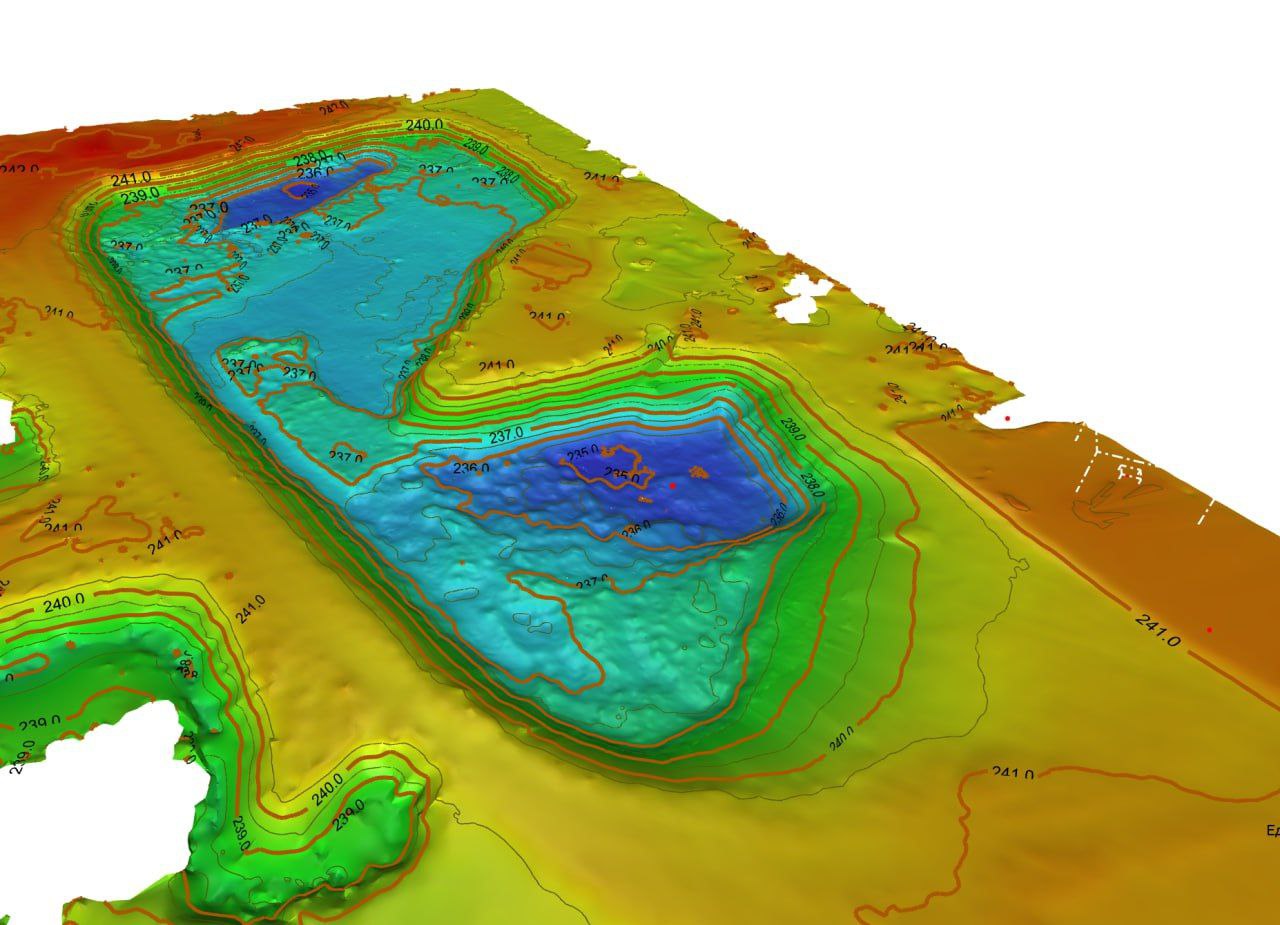
Bathymetric Surface (DEM / TIN)
High-density single-beam soundings gridded into a continuous bottom surface. GeoTIFF DEM, contour SHP, LandXML TIN.
Water-Cap Volume
Total volume between the survey-day water surface and the captured tailings interface, with stage-storage curve referenced to your operating elevations.
Capacity-Elevation Table
Volume at incremental elevations across the operating envelope — the working numbers your operations and reporting teams plug straight in.
Sediment Accumulation Raster
On repeat surveys, a DEM-of-difference between current and baseline bathy showing where the tailings interface has risen and by how much.
Cross-Sections & Profiles
Operator-defined cross-sections through the pond, longitudinal profiles, and any dam-face or beach-toe profiles required for safety reporting.
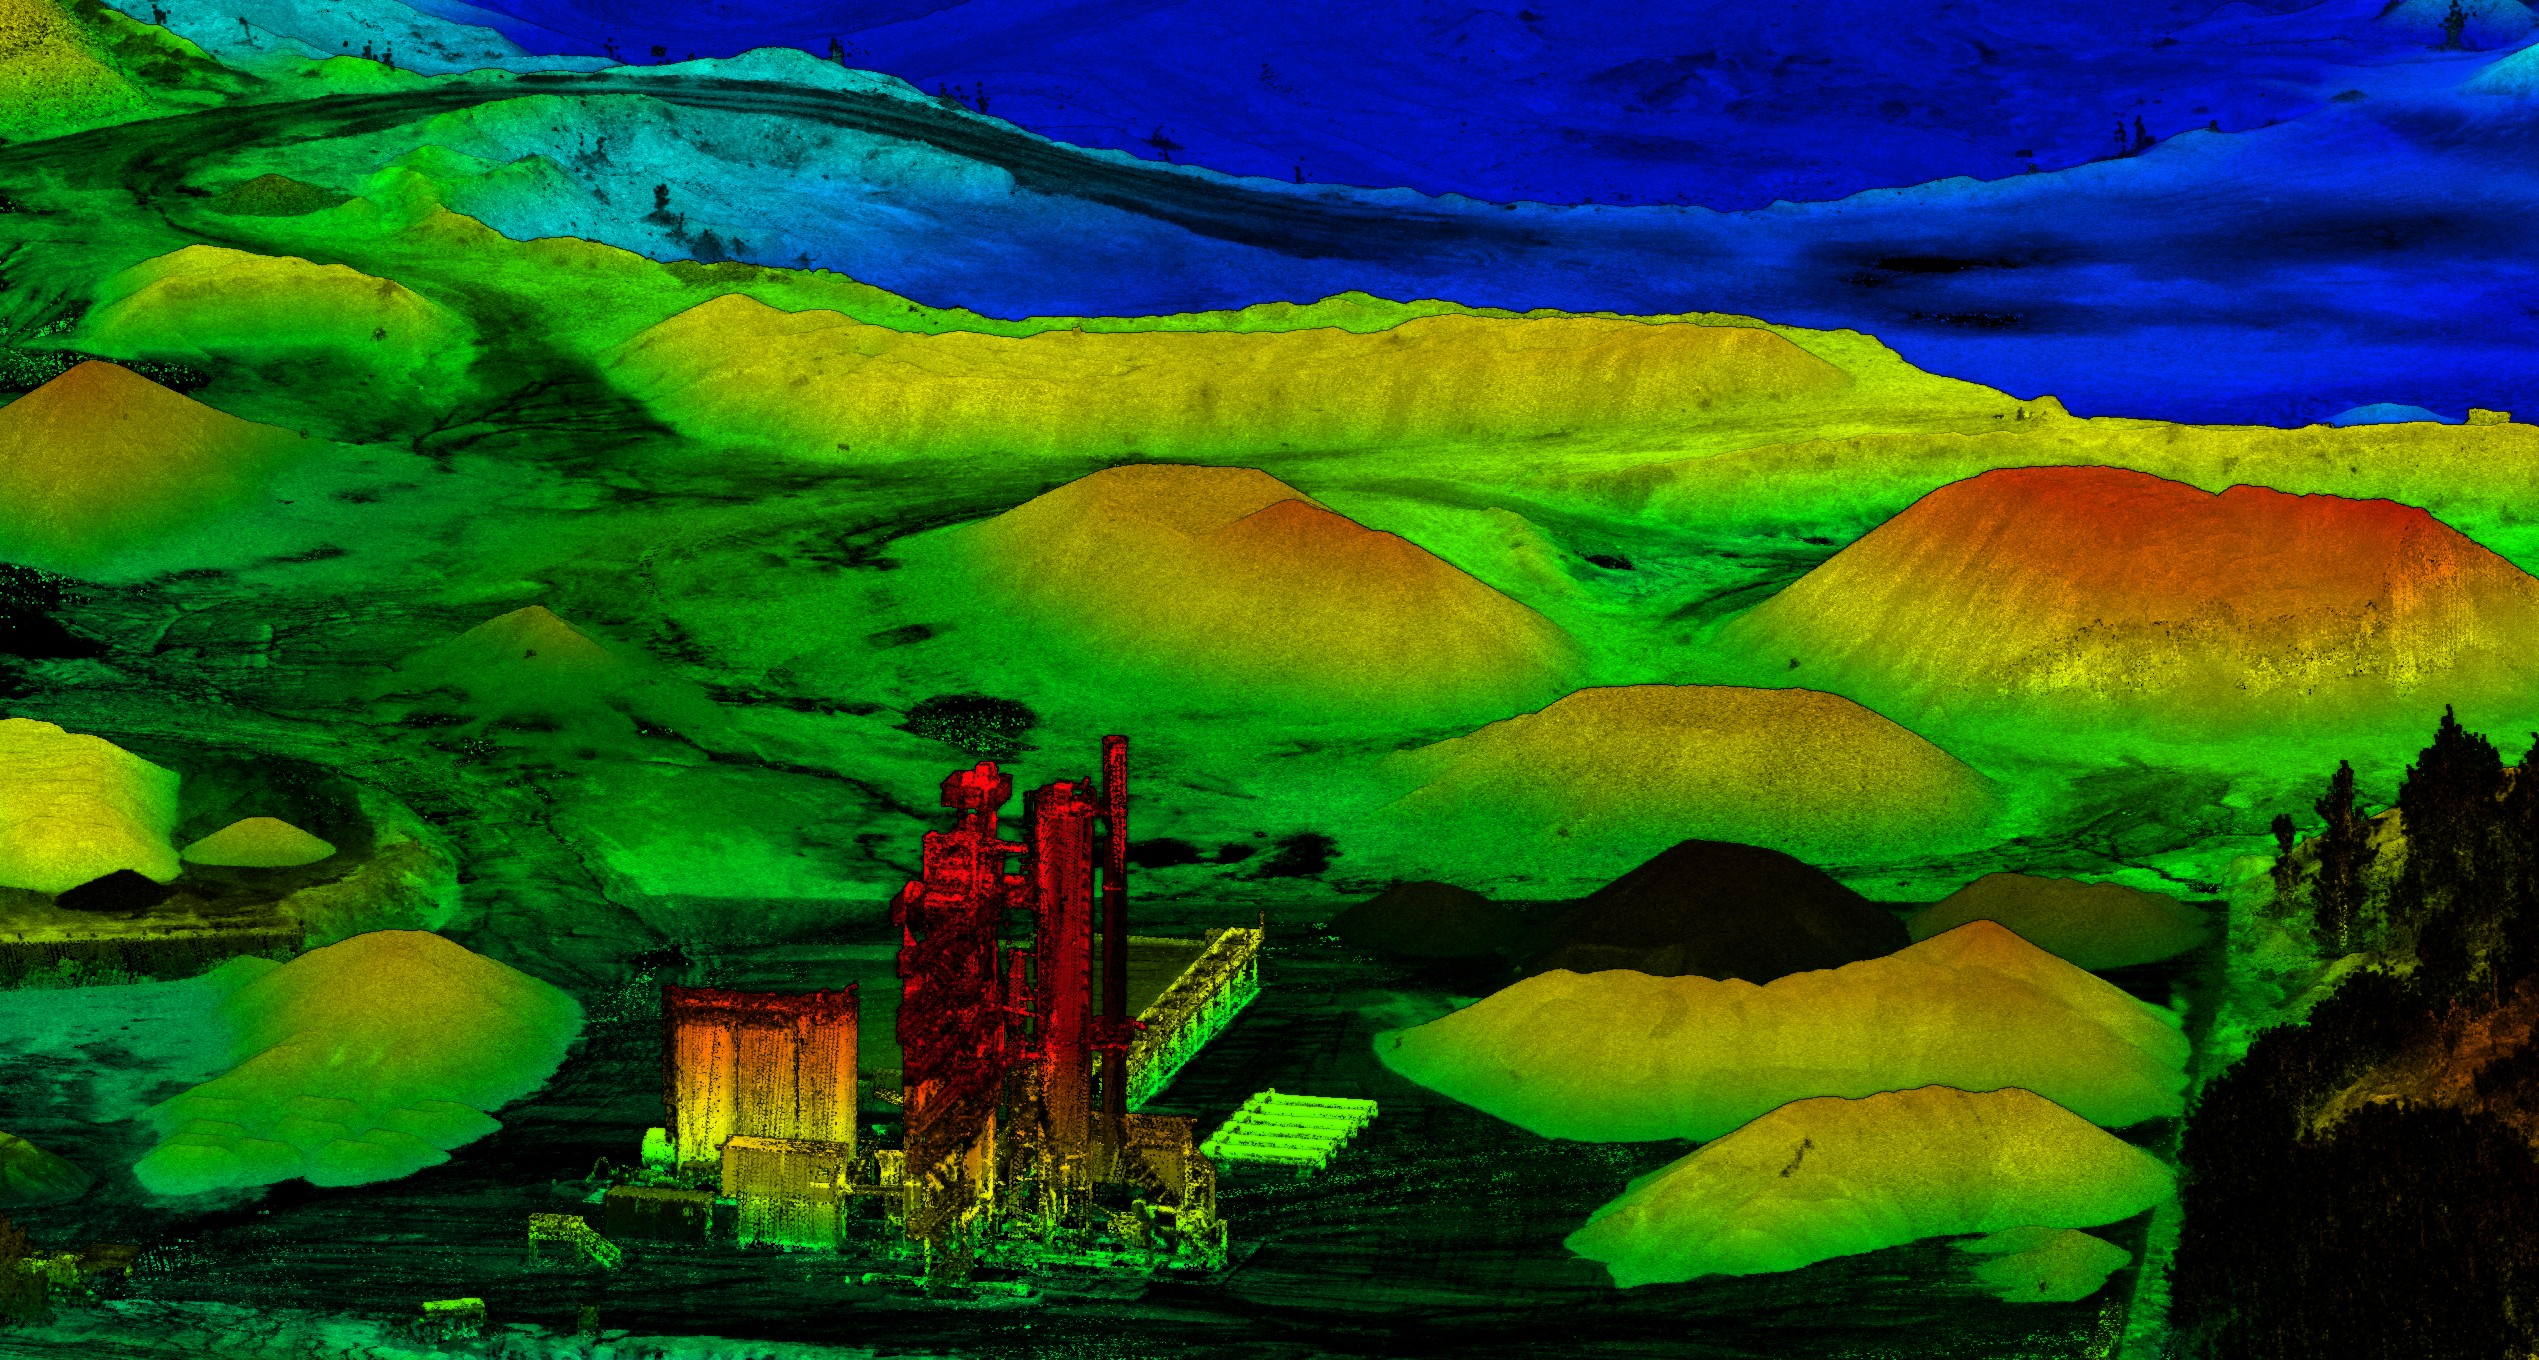
File Formats
DWG, LandXML, classified LAS / LAZ, GeoTIFF, ESRI Shapefile and GeoPackage, CSV soundings, and stamped PDF maps as required.
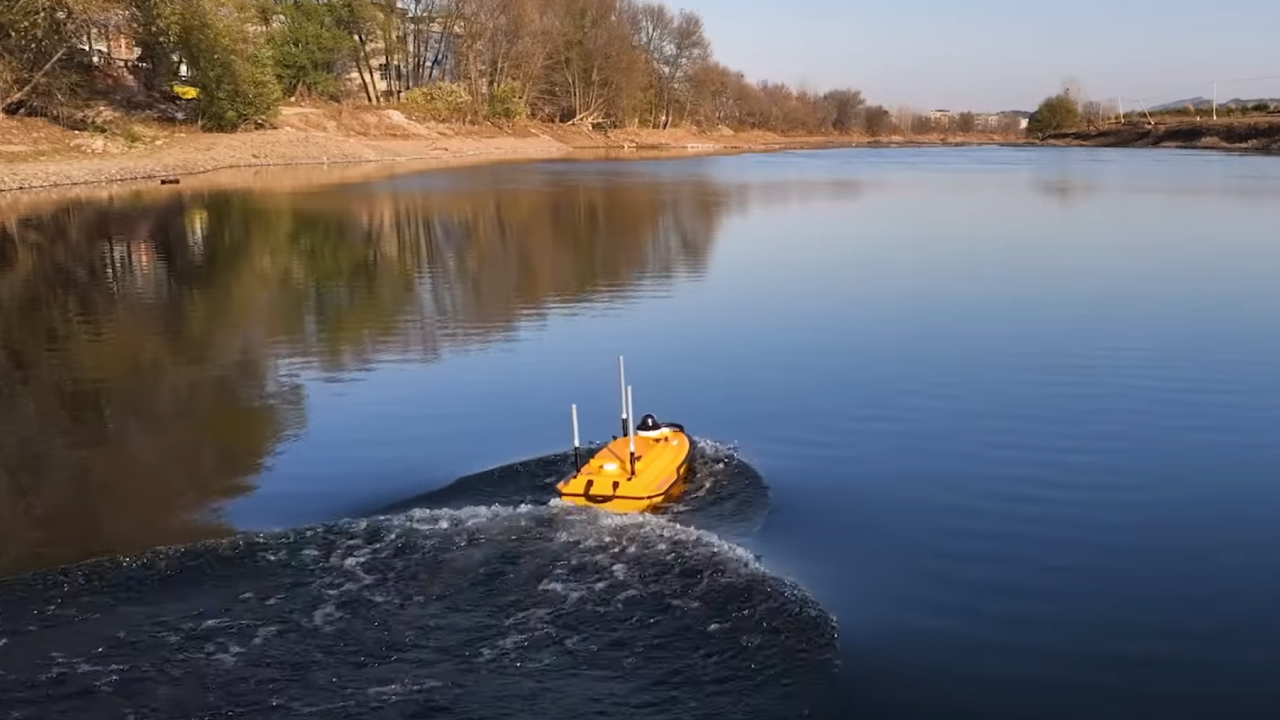
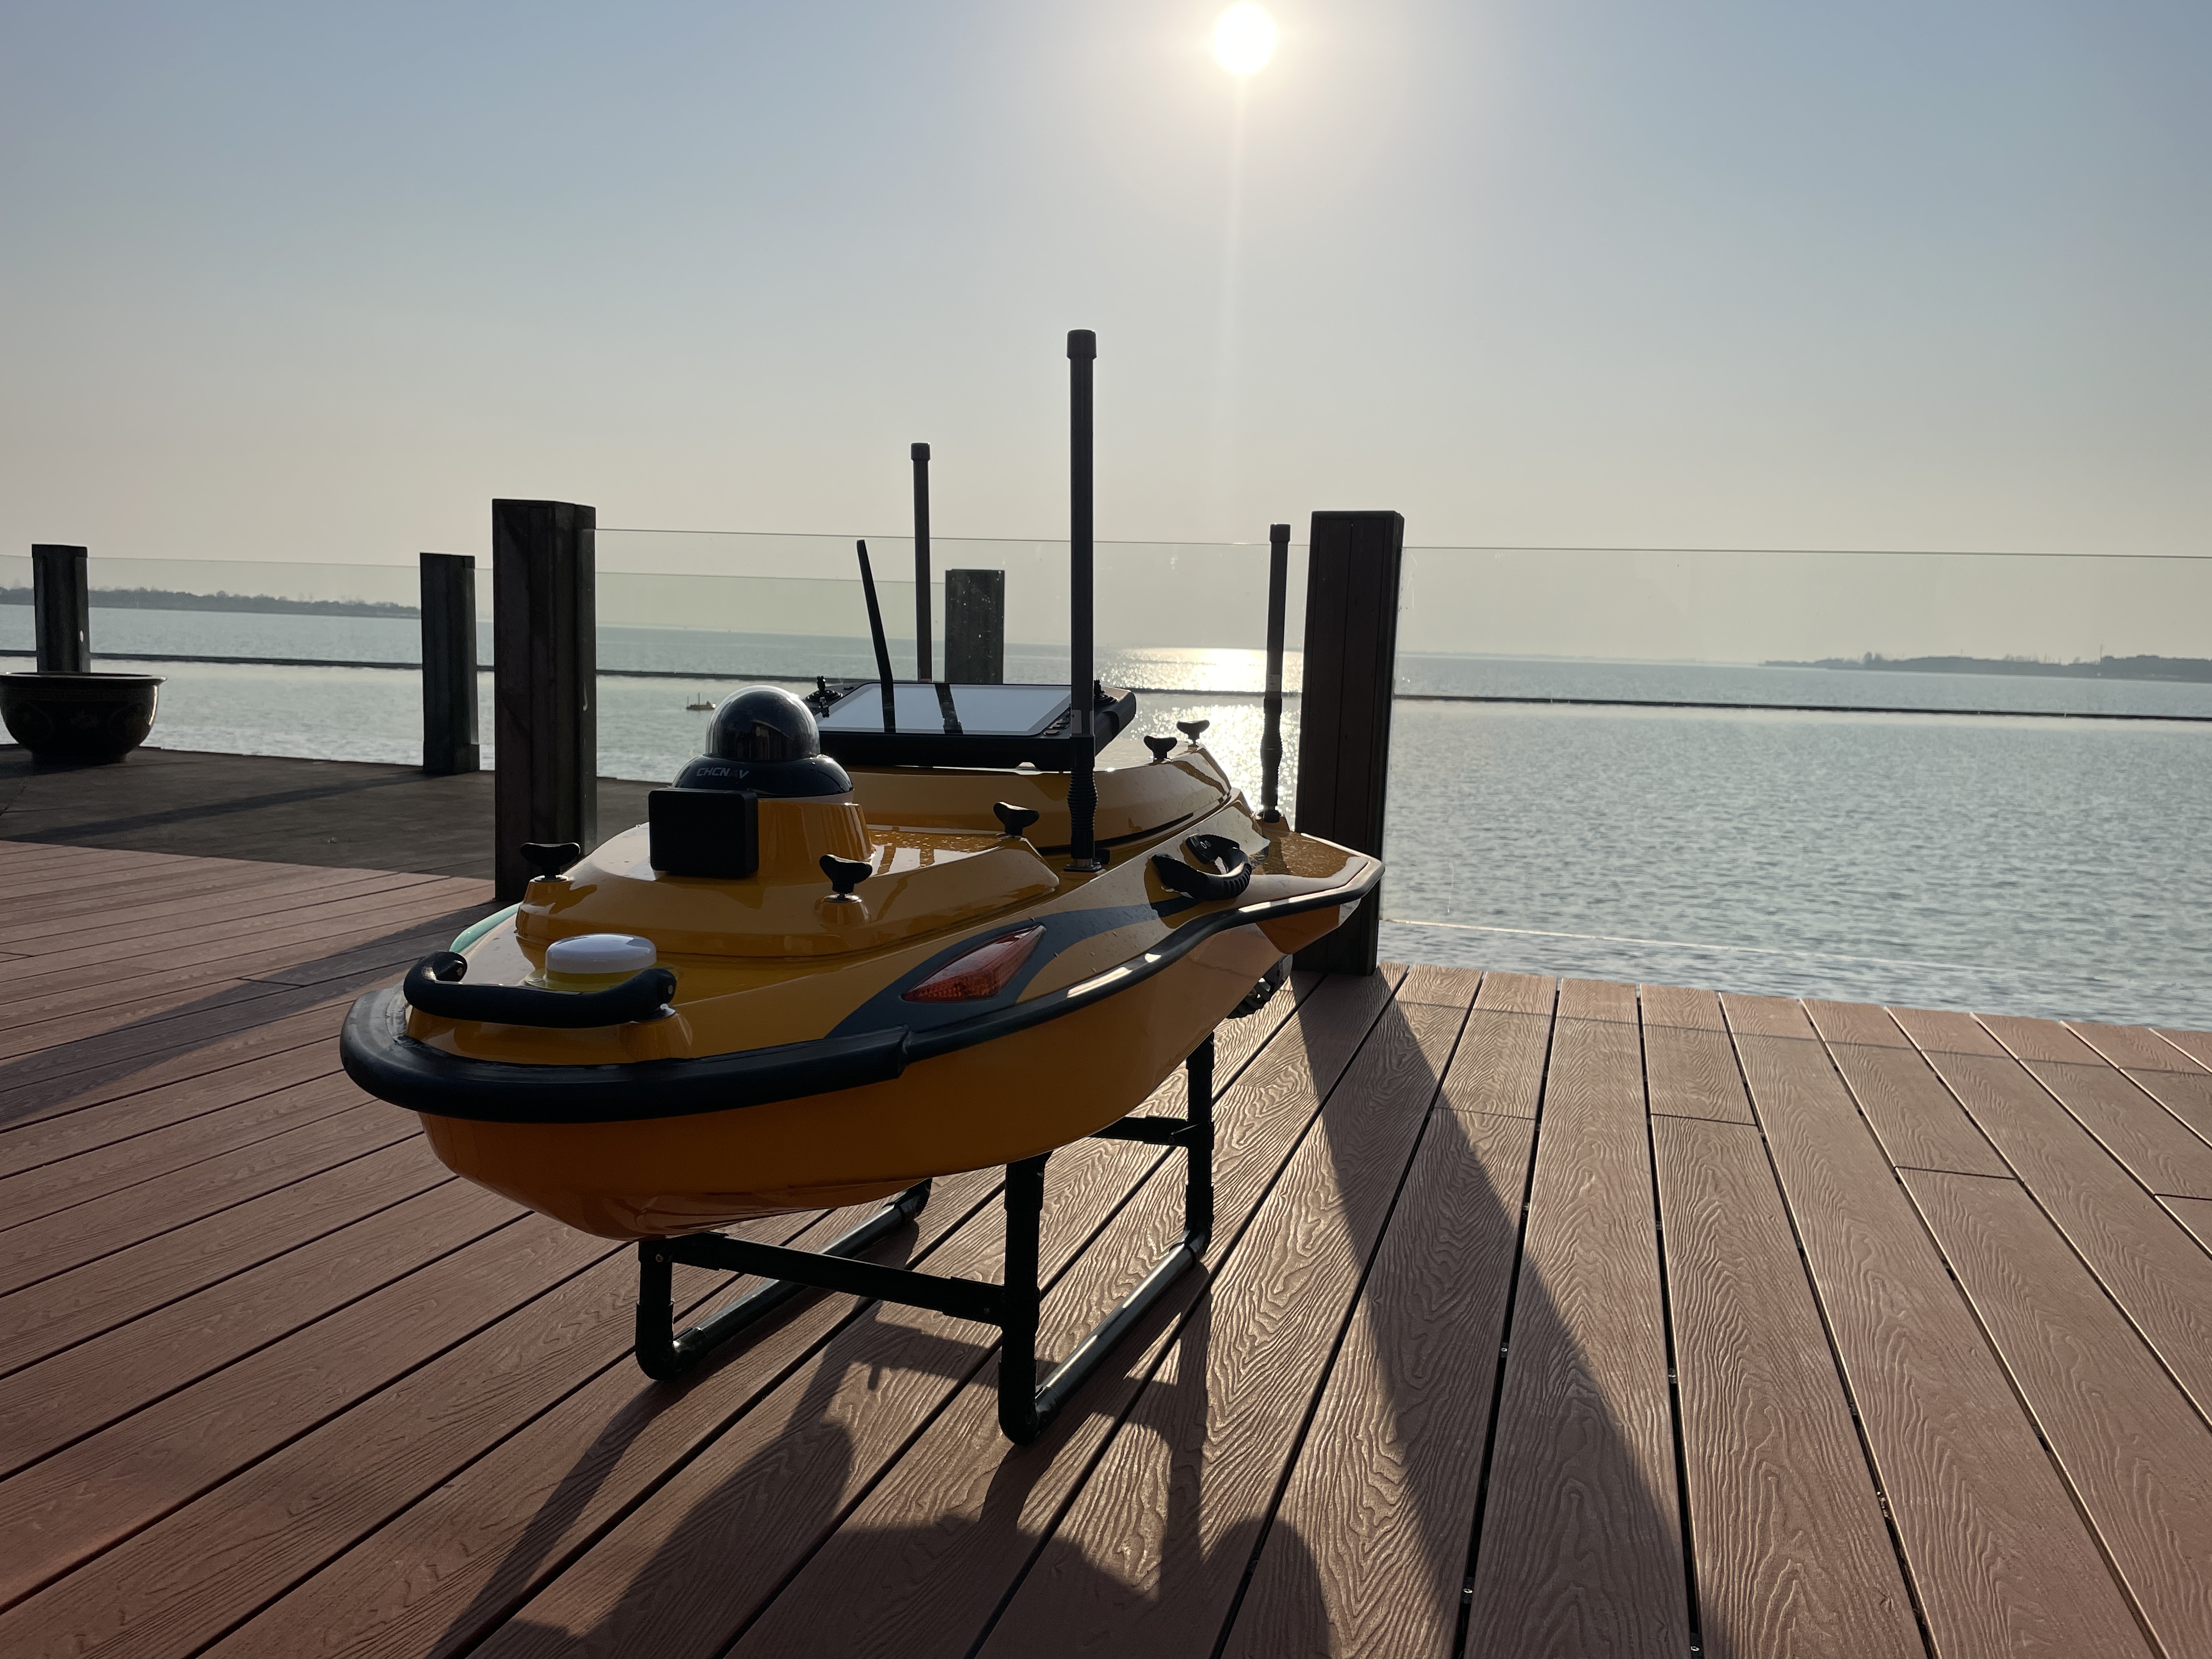
How We Capture It
A USV equipped with single-beam echo sounder and RTK GNSS runs a planned survey grid across the pond. Line spacing is set per facility and reporting requirement (typically 10–25 m apart, tighter near dam faces and discharge points). The USV can be operated autonomously from the bank or remotely via a shore-based operator depending on facility rules.
Two-Surface Capture
The echo sounder records returns from the water-tailings interface and, where signal allows, the deeper tailings-bedrock or tailings-liner contact. The water-tailings interface is always delivered. The deeper surface is delivered where signal strength supports a defensible measurement; otherwise we deliver the upper surface and a water-cap volume referenced to your most recent beach / surface topo survey.
Shore Control
Survey control on the dam crest and stable beach areas ties the bathy into your facility coordinate system so repeat surveys compare apples-to-apples. We can integrate with your existing monitoring network or establish independent control for the survey.
No Crew on the Water
All operations are conducted from the bank or dam crest. No respirator-grade PPE in play, no operator exposure to process water, no boat to retrieve if conditions change. This is the wedge.
Why Operations and Dam Safety Teams Use This
Capacity-elevation curves drive your day-to-day operations — deposition planning, water management, recycle volumes. We rebuild that curve from current bathy, not from a five-year-old design surface.
For dam safety reporting, a repeat-survey sediment accumulation raster tells your engineer where the tailings interface is rising fastest, how the deposition pattern is shifting, and whether the upstream-progression assumption your facility was designed on still holds.
For environmental reporting, the water-cap volume and tailings interface elevation feed your operating criteria submissions and any cover thickness reporting your closure planning needs.
For closure and reclamation planning, a fully captured pre-closure bathy is the baseline a 25-year monitoring program will reference back to.
Frequently Asked Questions
Why USV bathymetry instead of a manned boat?
Unmanned surface vessels keep operators off toxic process water. Since the Mount Polley failure in 2014, industry preference has shifted strongly toward minimising crew exposure on tailings facilities. A USV captures the same data as a manned boat with no operator at risk, no respirator-grade PPE in play, and faster mobilisation.
What accuracy can I expect under tailings water?
Single-beam echo sounder bathymetry typically achieves 5–15 cm vertical depending on water column properties, suspended solids, and signal return strength at the tailings interface. For most volume reporting and capacity work this resolution is well inside the required tolerance.
Do you survey both the water cap and the tailings interface?
Yes. Where the echo sounder can resolve both the water-tailings interface and the deeper tailings-bedrock or tailings-liner contact, we deliver both surfaces. Where only the upper interface returns reliably, we deliver that surface plus a water-cap volume referenced to your most recent surface beach survey.
How often should we re-survey?
Annual or semi-annual cadence is common for active facilities; the frequency is driven by your operating criteria and reporting requirements. Repeat surveys against a stable baseline produce sediment accumulation rasters that feed dam safety and operating reporting directly.
Can you operate year-round?
We plan around freeze-thaw cycles and facility operating conditions. Open-water seasons are typical for USV deployment. Winter ice-method surveys are an option for some facilities where USV launch is not practical and your operations group permits drill-hole access.
How do you integrate with our existing monitoring data?
We tie new bathy into your facility coordinate system using your existing monument network where available, or we establish independent shore control referenced to a known datum. Repeat surveys re-occupy the same control so multi-year comparison is on a consistent framework.