
Overview
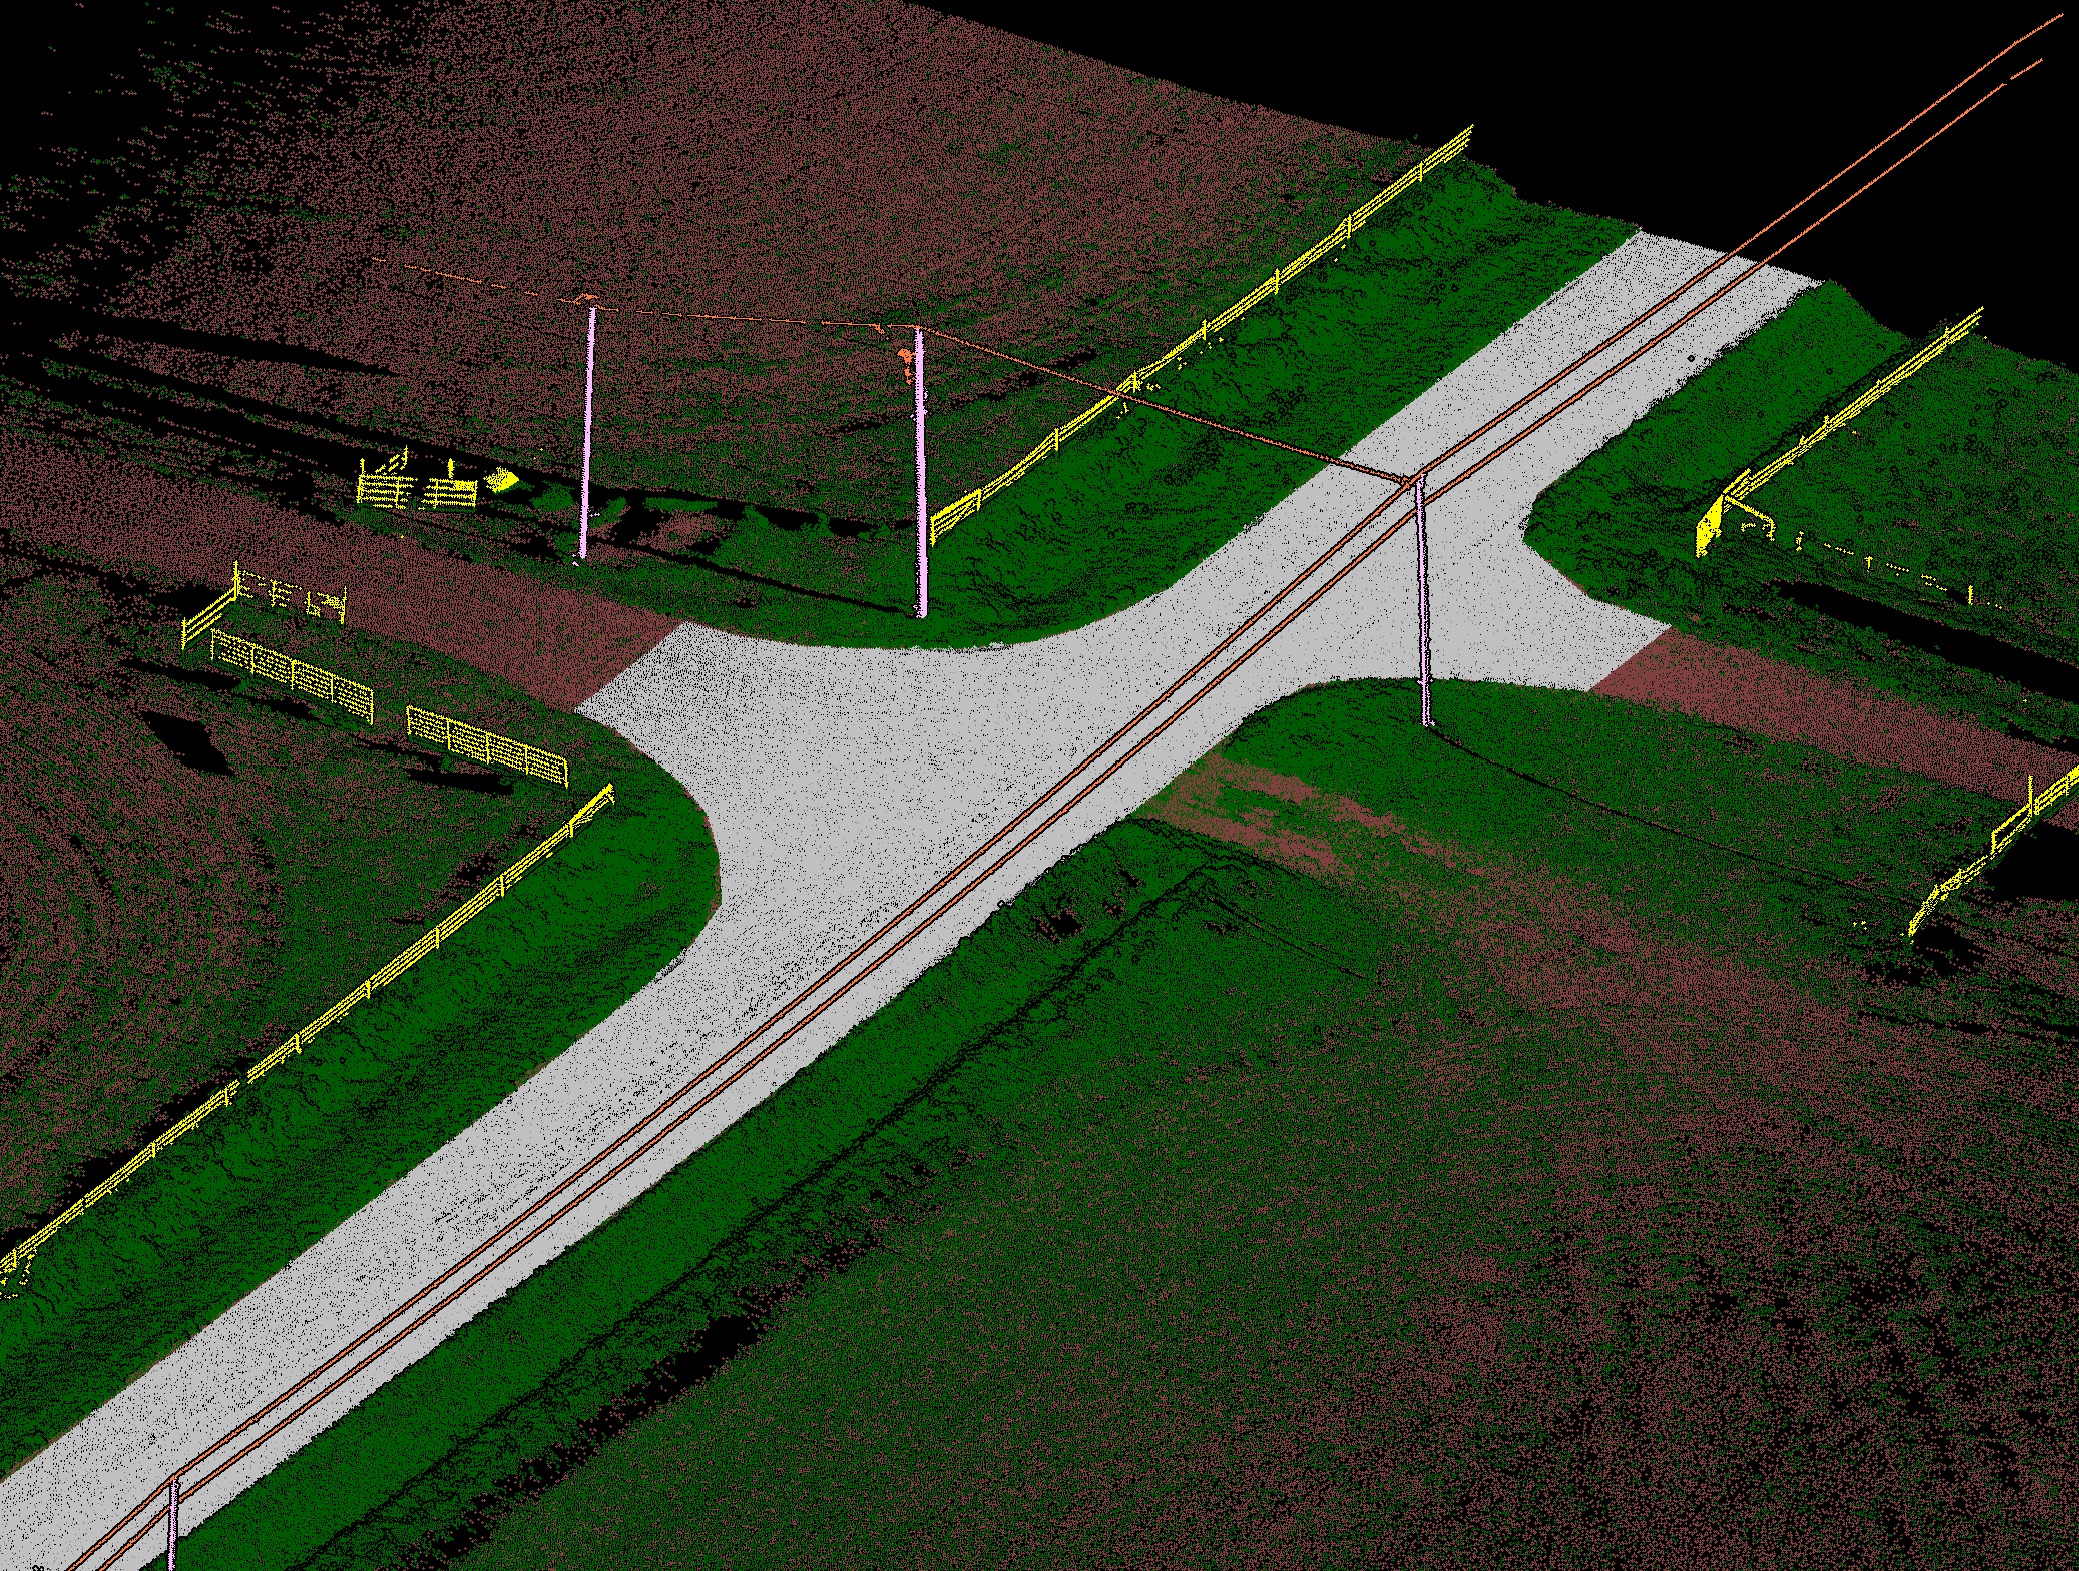
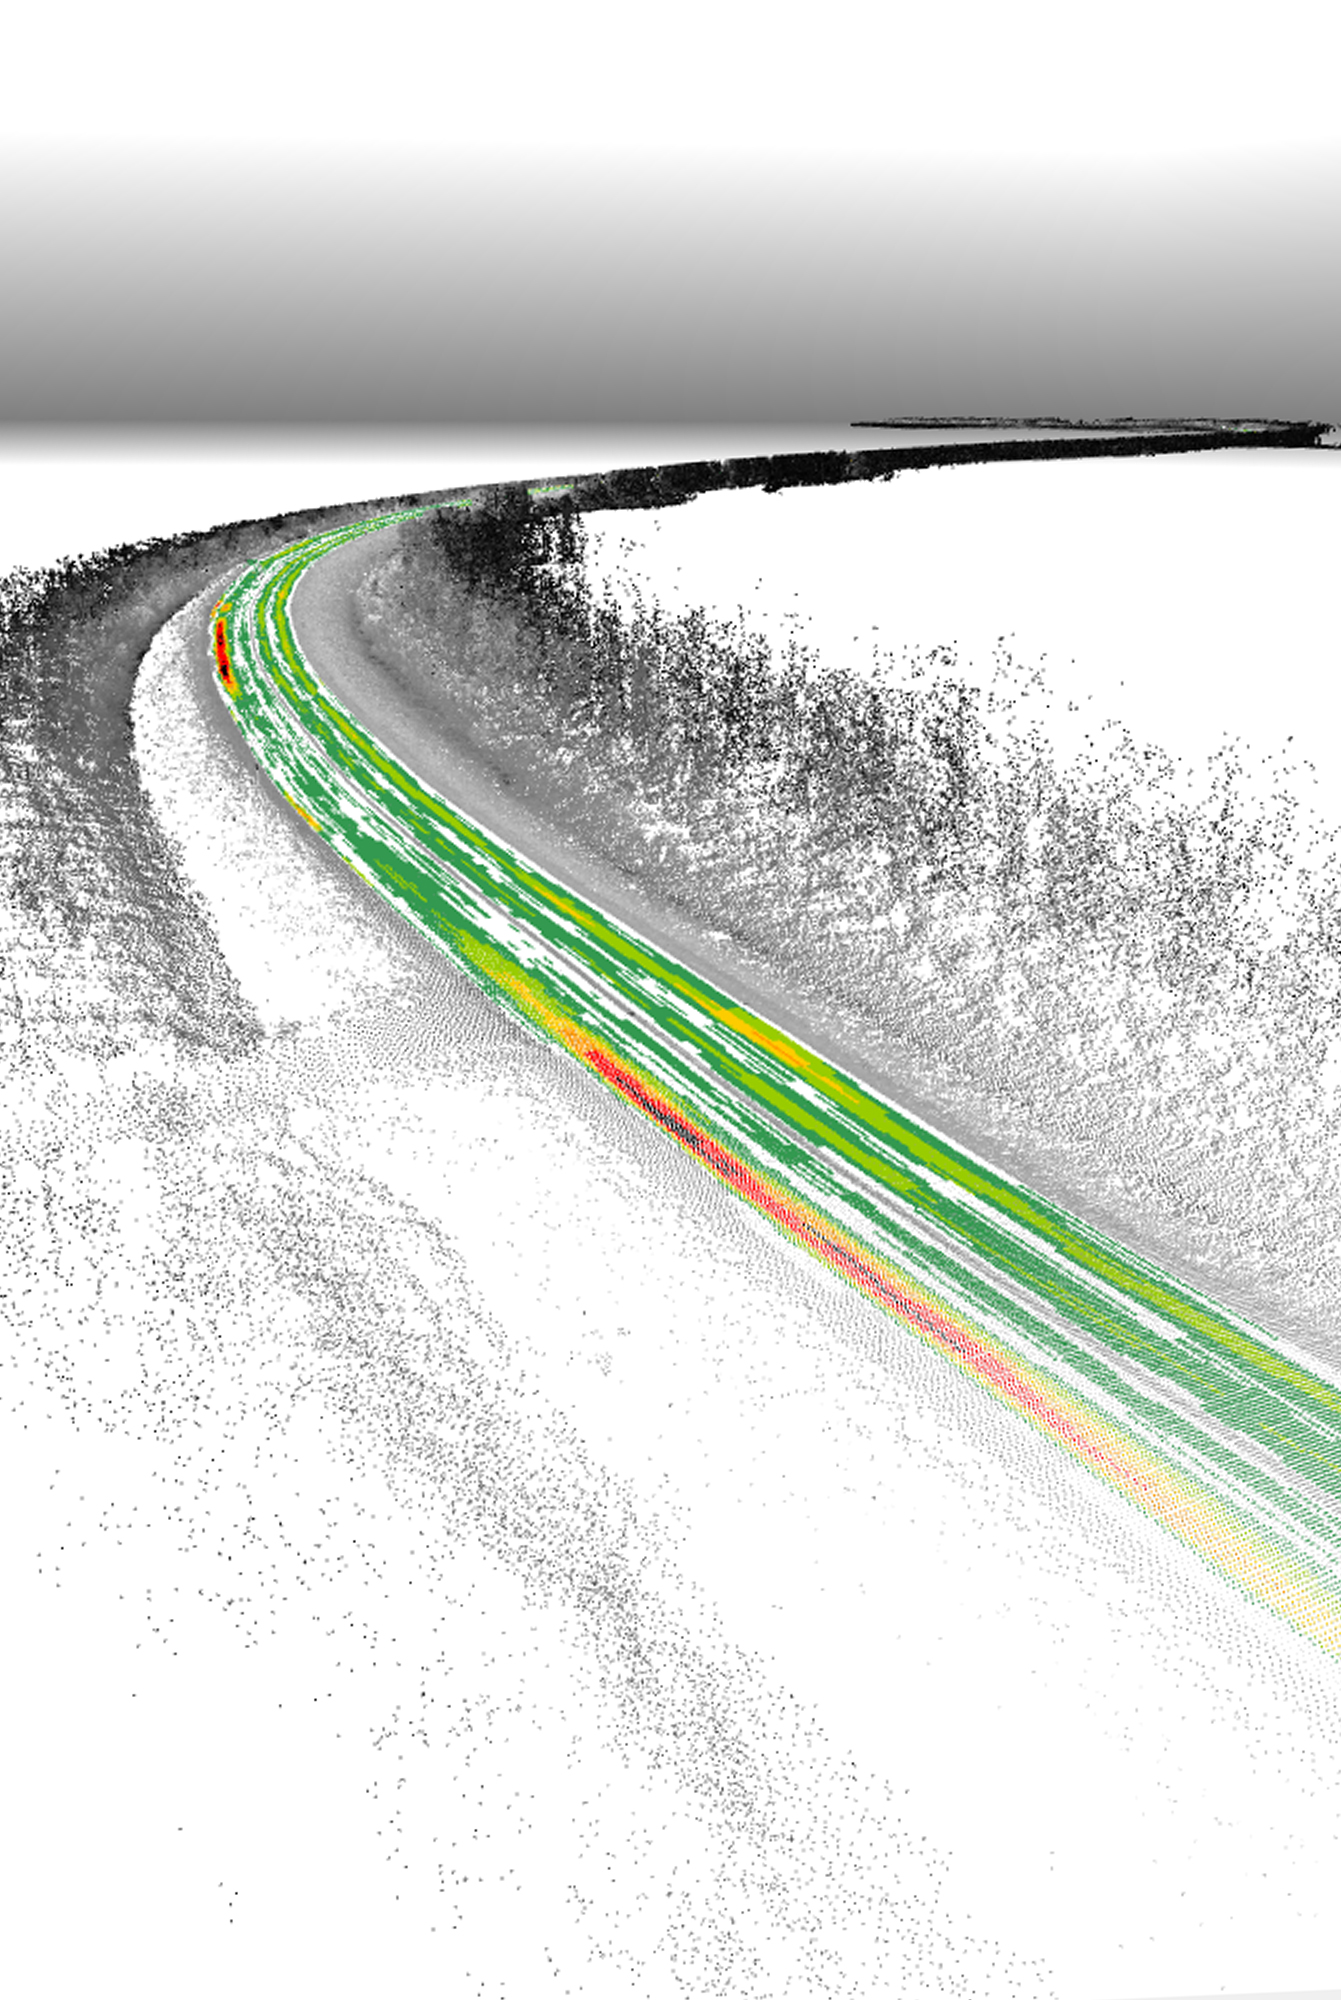
We measure and verify road condition and geometry using mobile LiDAR, inertial profilers, and panoramic imaging. Our workflows compute IRI/roughness, rutting, crossfall and superelevation, lane and shoulder widths, curb & gutter position, vertical and side clearances, and sight distance — delivered as CAD/GIS layers with a rigorous QC report. For deeper context on what separates strong mobile LiDAR providers, see our Not All LiDAR Services Are Equal article.
*Depends on GNSS conditions and control/checkpoint strategy.
Mobile LiDAR vs Traditional Pavement Inspection
How modern mobile LiDAR road QA compares to traditional methods.
| Capability | Manual Walk | Profilometer | Mobile LiDAR (ours) |
|---|---|---|---|
| Network kilometres / day | < 5 | 30–60 | 100–300 |
| Operator safety | At risk in traffic | In-traffic vehicle | In-traffic vehicle |
| Captures geometry, IRI, defects | Limited | IRI / rutting only | Full coverage |
| Re-walk for re-inspection | Required | Required | Re-process scan |
| Best fit for | Spot inspections | High-speed IRI | Engineering-grade QA |
See real deliverables
Open our Sample Data Portal — preview orthophotos, point clouds & 3D tiles in your browser.
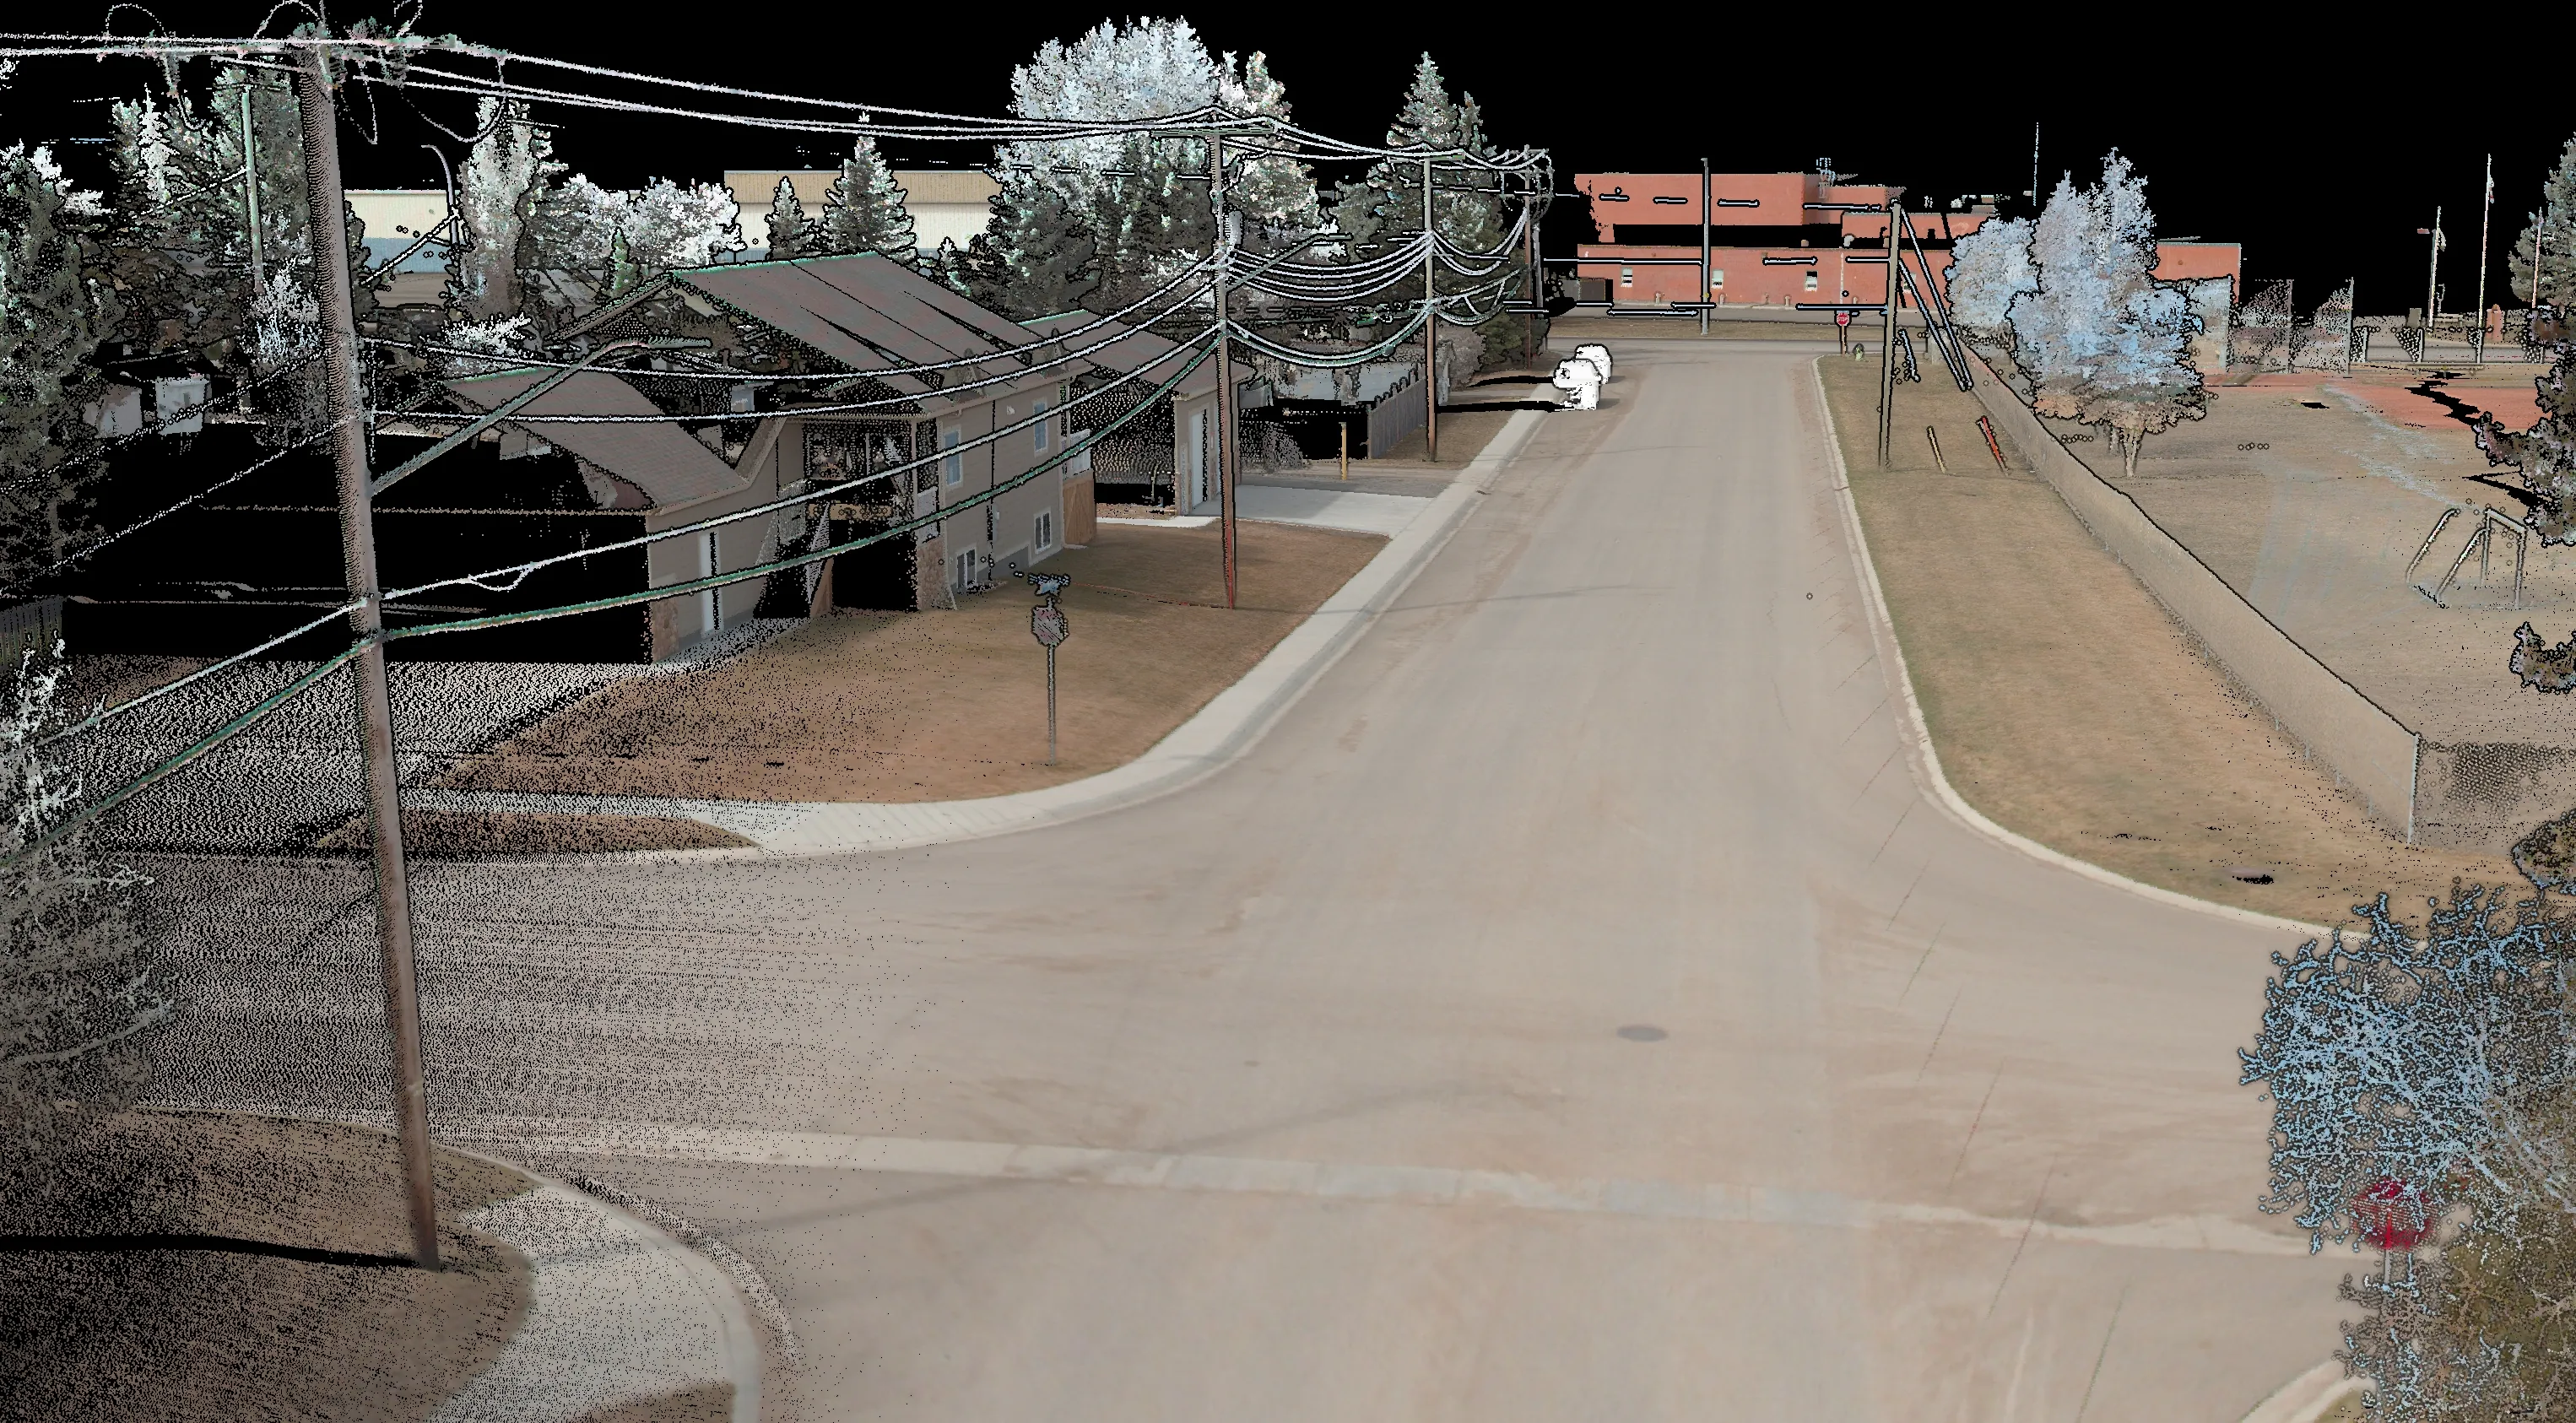
Municipal Road Quality Assurance
Mobile LiDAR road condition survey delivering IRI, rutting, cracking and ride-quality metrics for a municipal network.
View all projectsMetrics & Tests
 Ride & Surface
- IRI/roughness indices (per lane)
- Rut depth; crossfall/superelevation
- Texture indicators (LiDAR/imagery-derived)
 Geometry & Safety
- Lane/shoulder widths, curb & gutter, edge drop
- Vertical/side clearances (bridges, signage, barriers)
- Sight-distance & envelope checks
 Compliance
- Design tolerance checks vs. alignment
- Change detection vs. previous surveys
- Construction lot acceptance (QA/QC)
Deliverables
 Core Data
- Classified point clouds (LAS/LAZ) incl. curb/edge
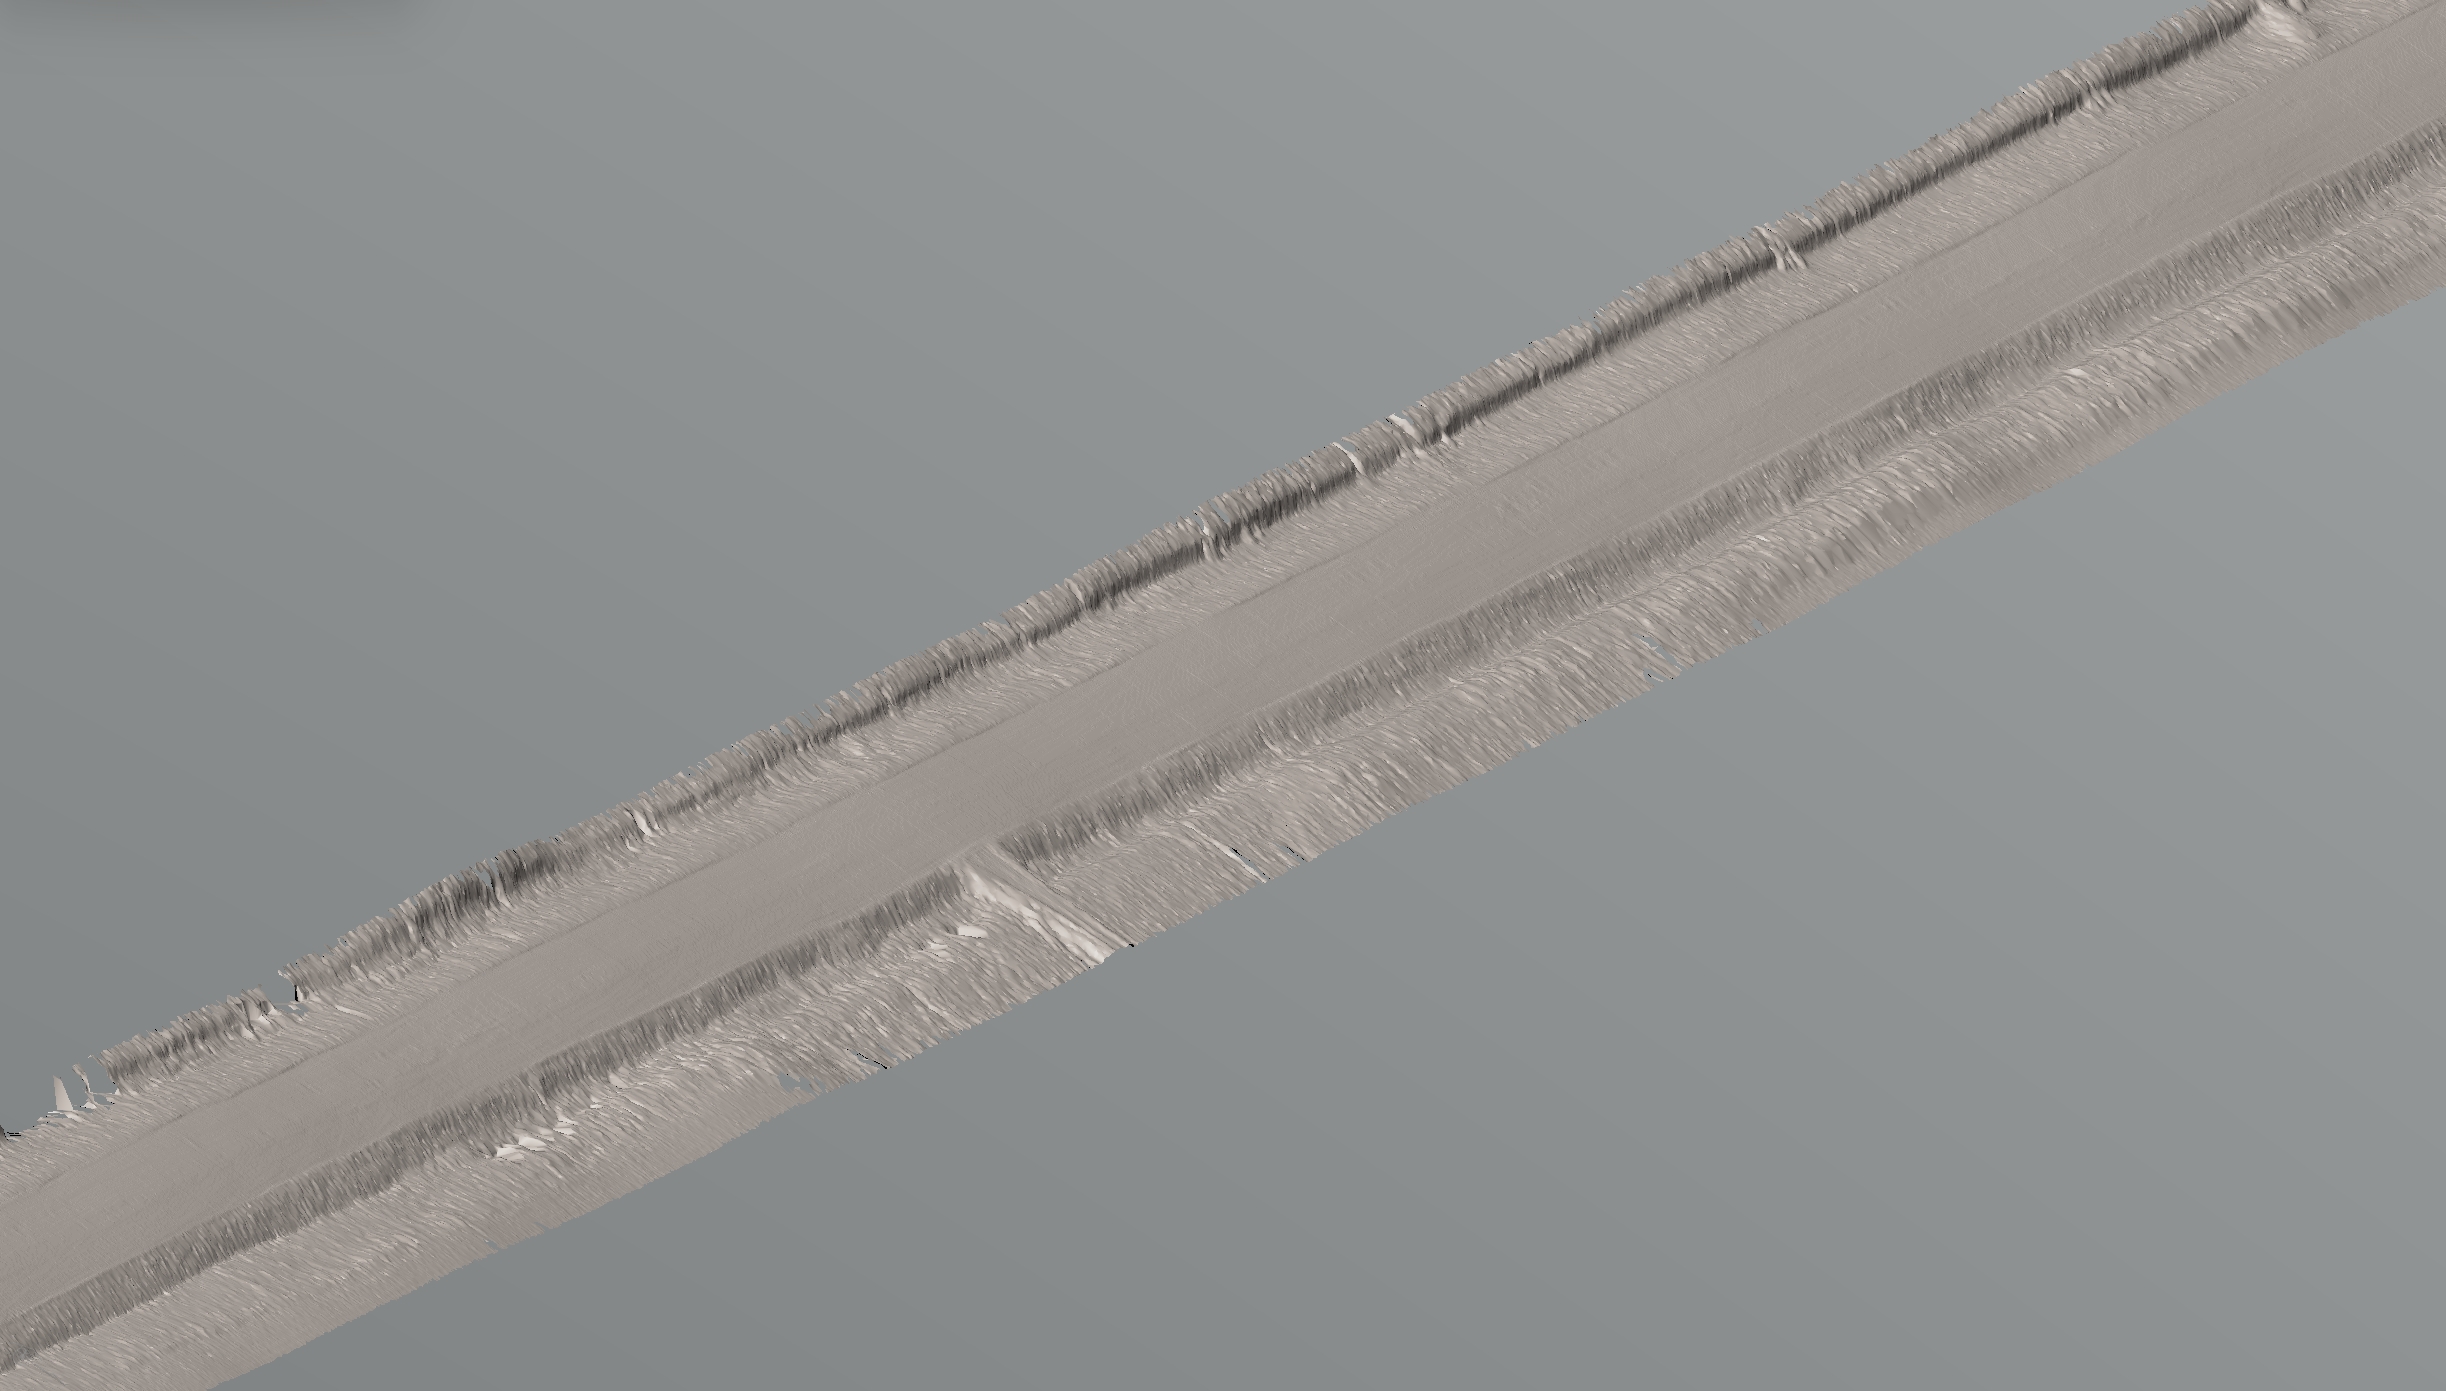
- DTM/DSM, contours, slope & hillshade rasters
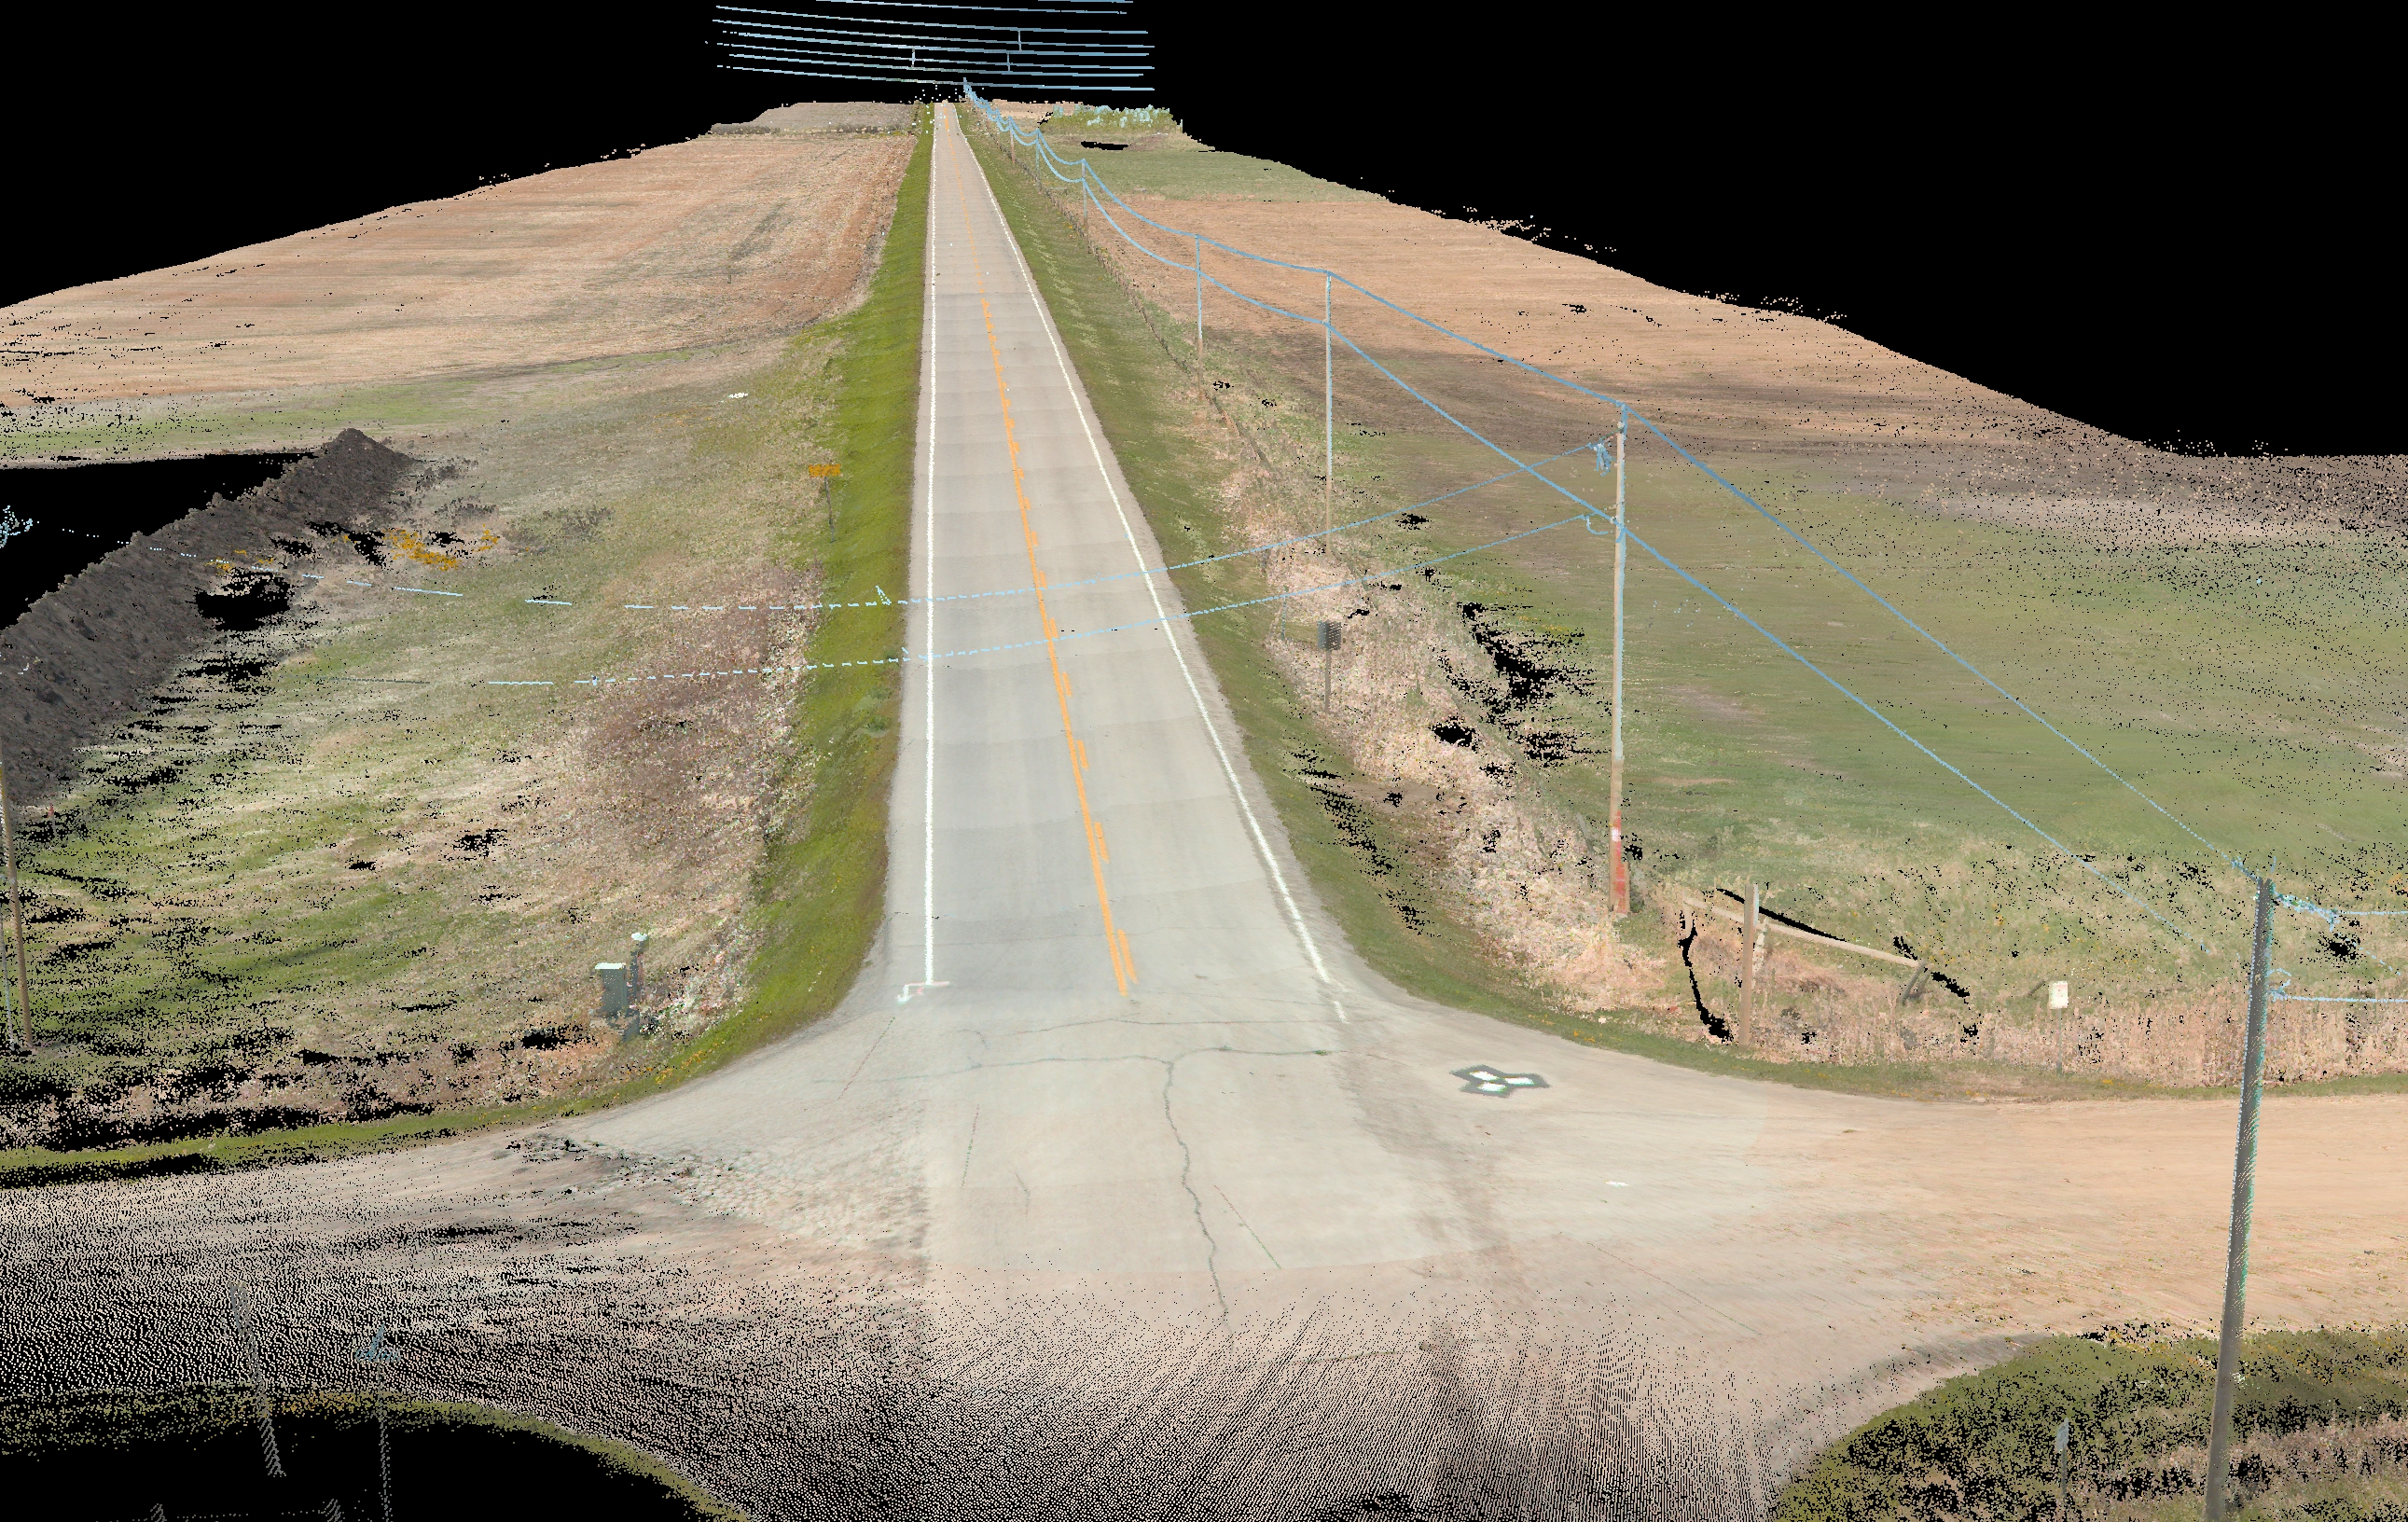
- Colorized point clouds and orthophotos (optional)
 Engineering Products
- IRI, rutting, crossfall, width maps (GeoTIFF/SHP)
- Cross-sections, profiles, and clearance reports
- Feature extraction: lane lines, signage, barriers, markings
 Formats
Workflow
- Route planning & safety plan; control layout
- Acquisition: mobile LiDAR + profilers at traffic speed
- Trajectory solution: GNSS/IMU PPK/PPP (SLAM if needed)
- Strip alignment: boresight, overlap residuals, bundle adjustment
- Cleaning & classification: pavement, curb/edge, obstacles
- Computation: IRI, rutting, crossfall, widths, clearances
- Packaging: CAD/GIS layers, profiles/sections, maps
- QA/QC report: checkpoints, RMSE, density, conformance
Technology
Sensors
- High-rate multi-return LiDAR (up to ~1M pts/s)
- Inertial profilers & wheel odometry
- Panoramic/RGB cameras for inventory & markings
Positioning
- Tightly coupled GNSS/IMU with PPK/PPP
- Local control & independent checkpoints
- SLAM assistance in GNSS-poor areas (as required)