Overview
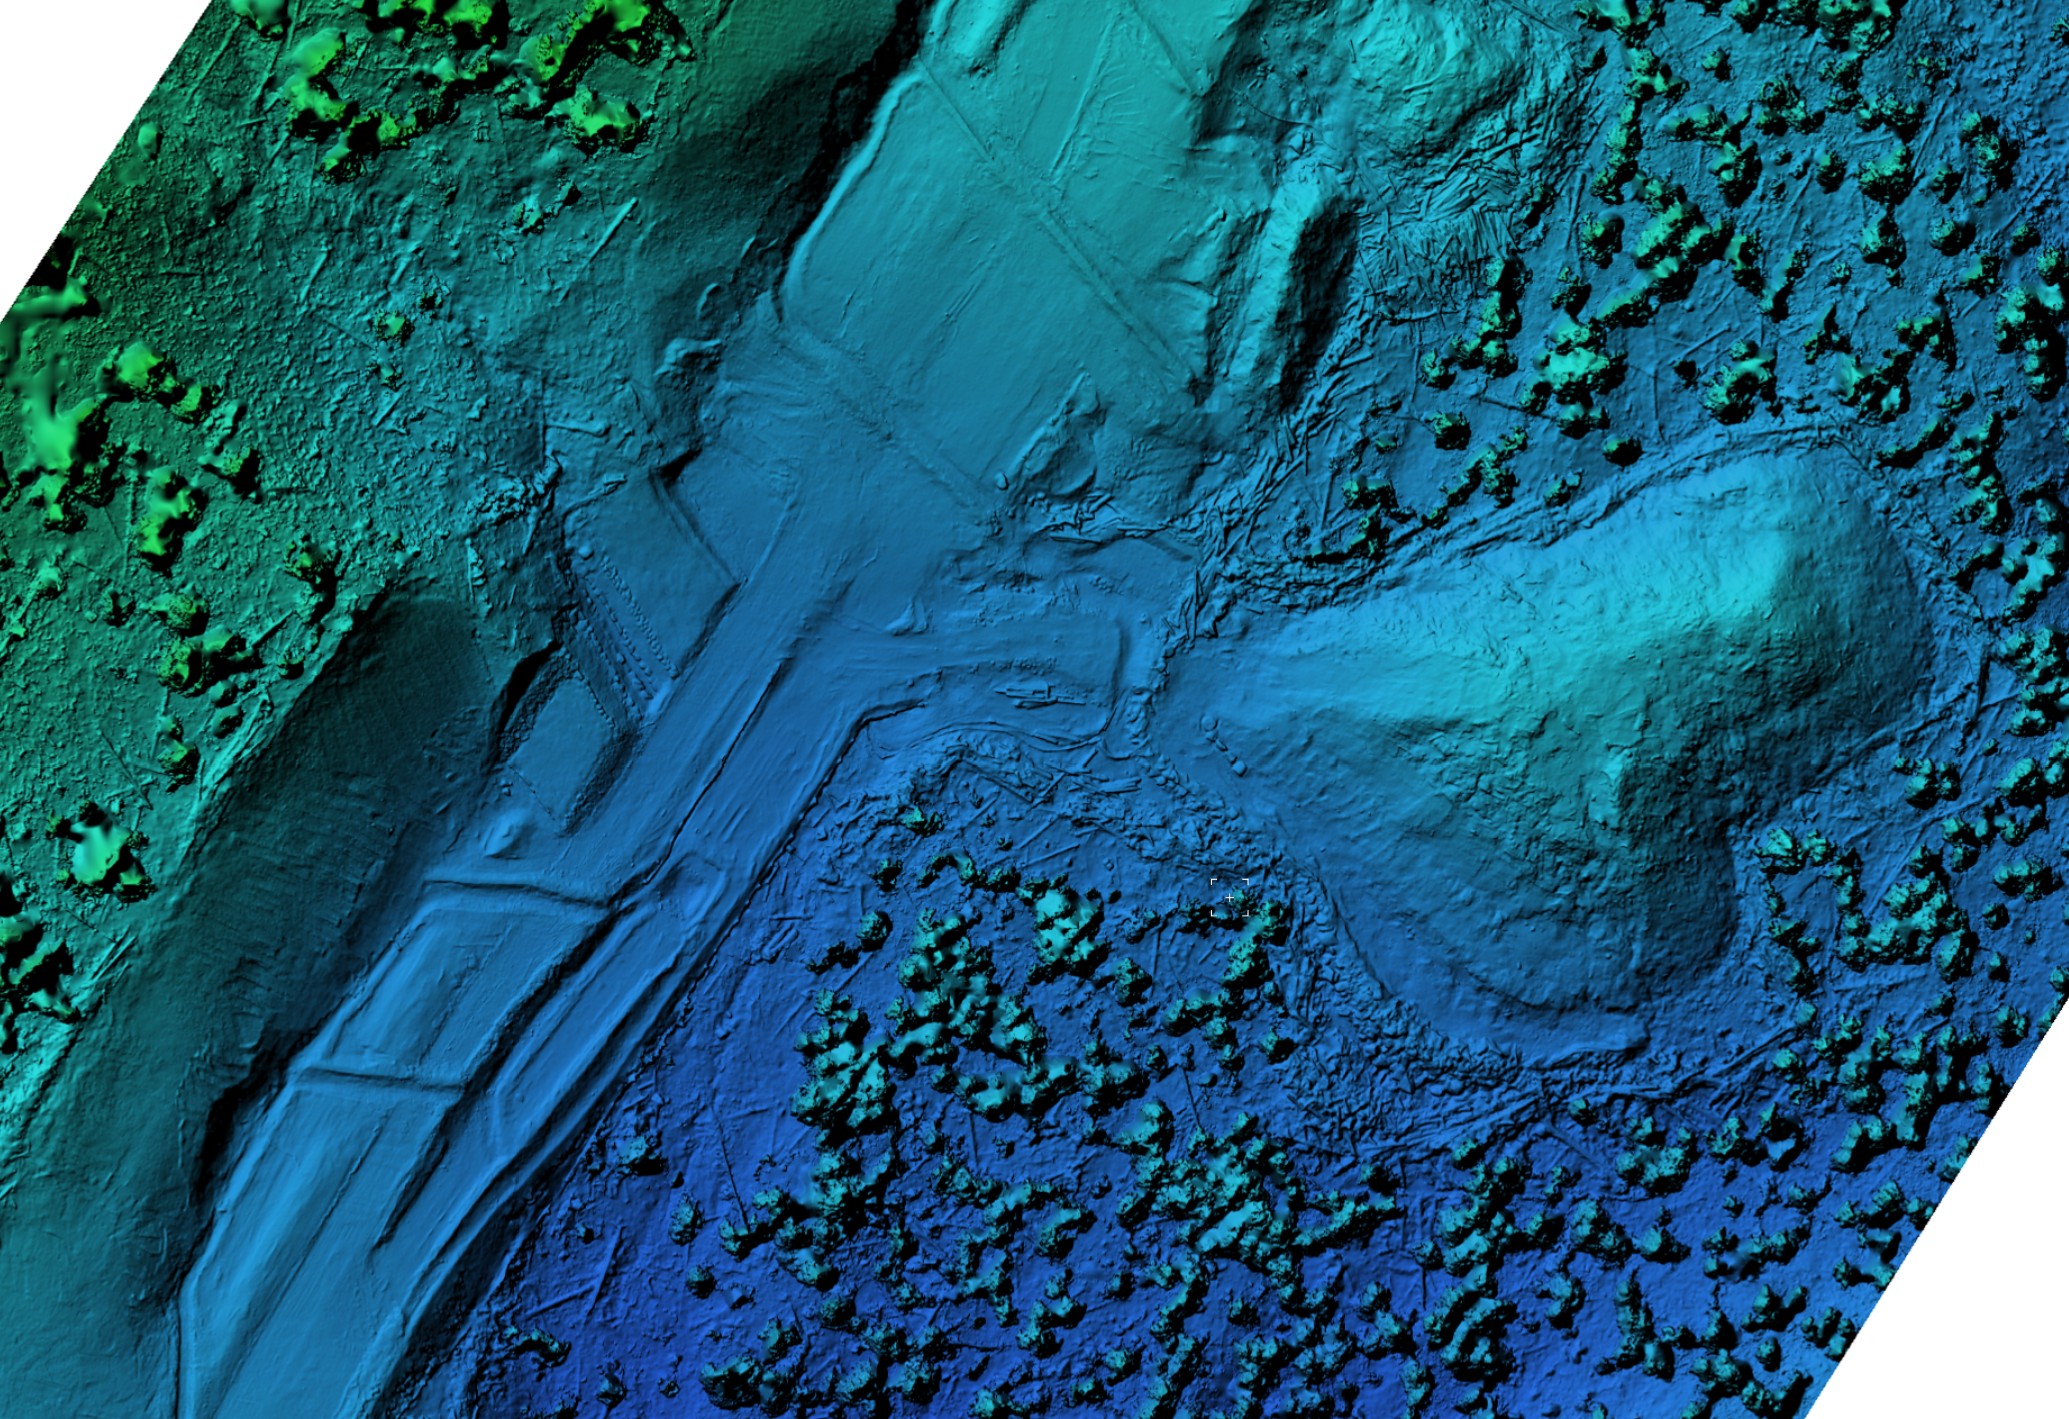
We measure stockpiles, borrow pits, and earthworks using UAV/mobile LiDAR and photogrammetry, tied to site control for consistent, repeatable results. Our reports include methodology, assumptions, and QA so stakeholders can track reconciliation and certify pay quantities with confidence.
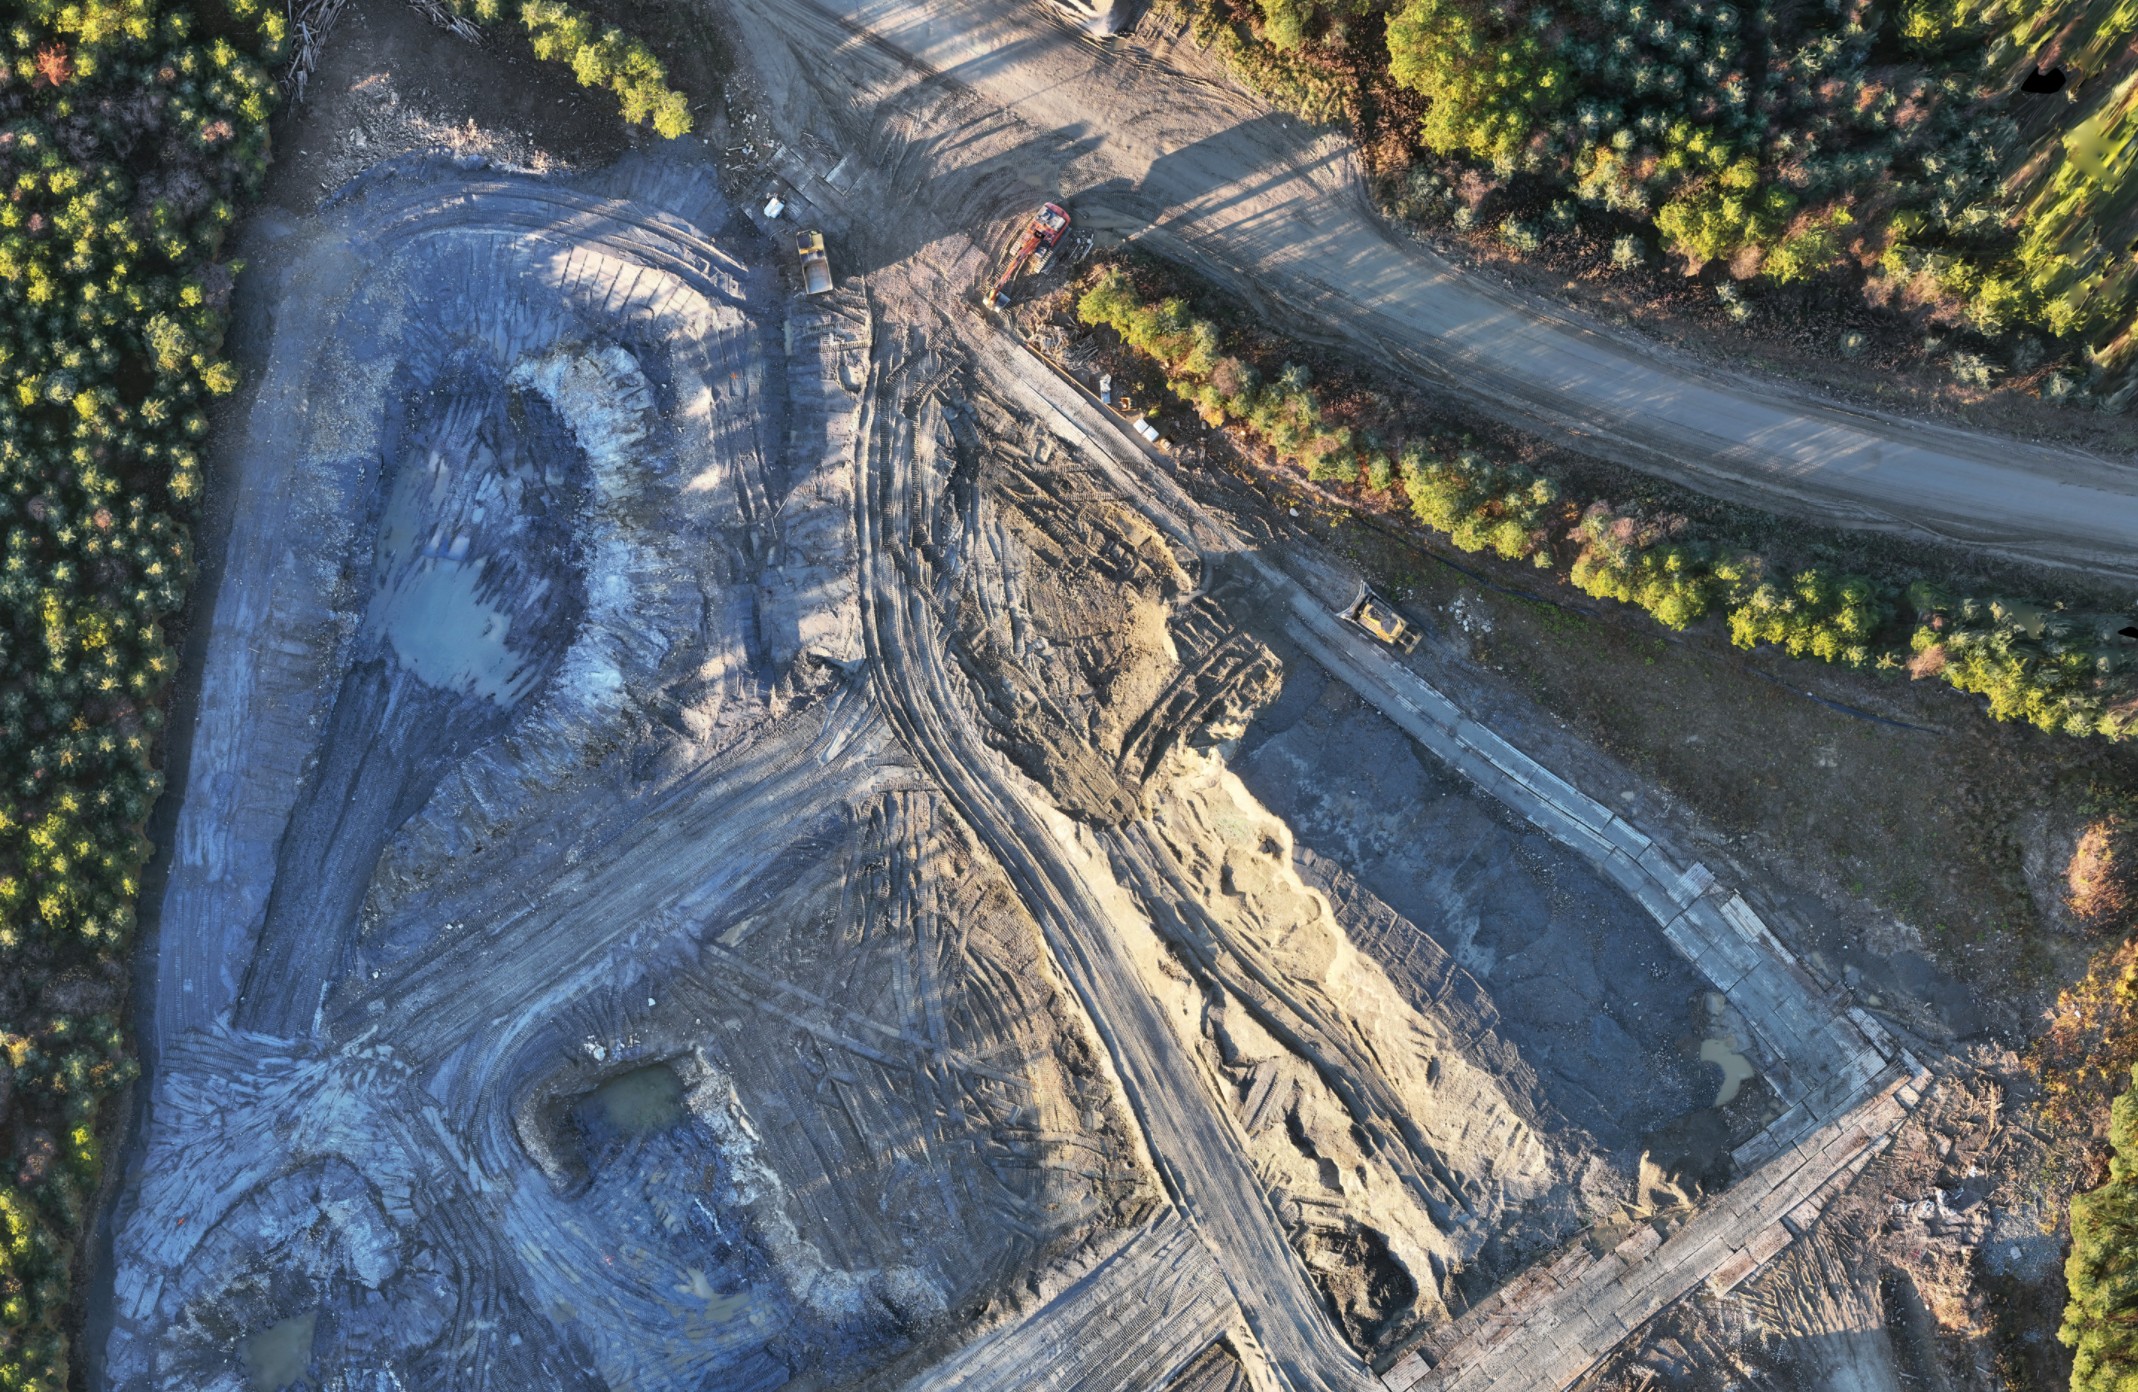
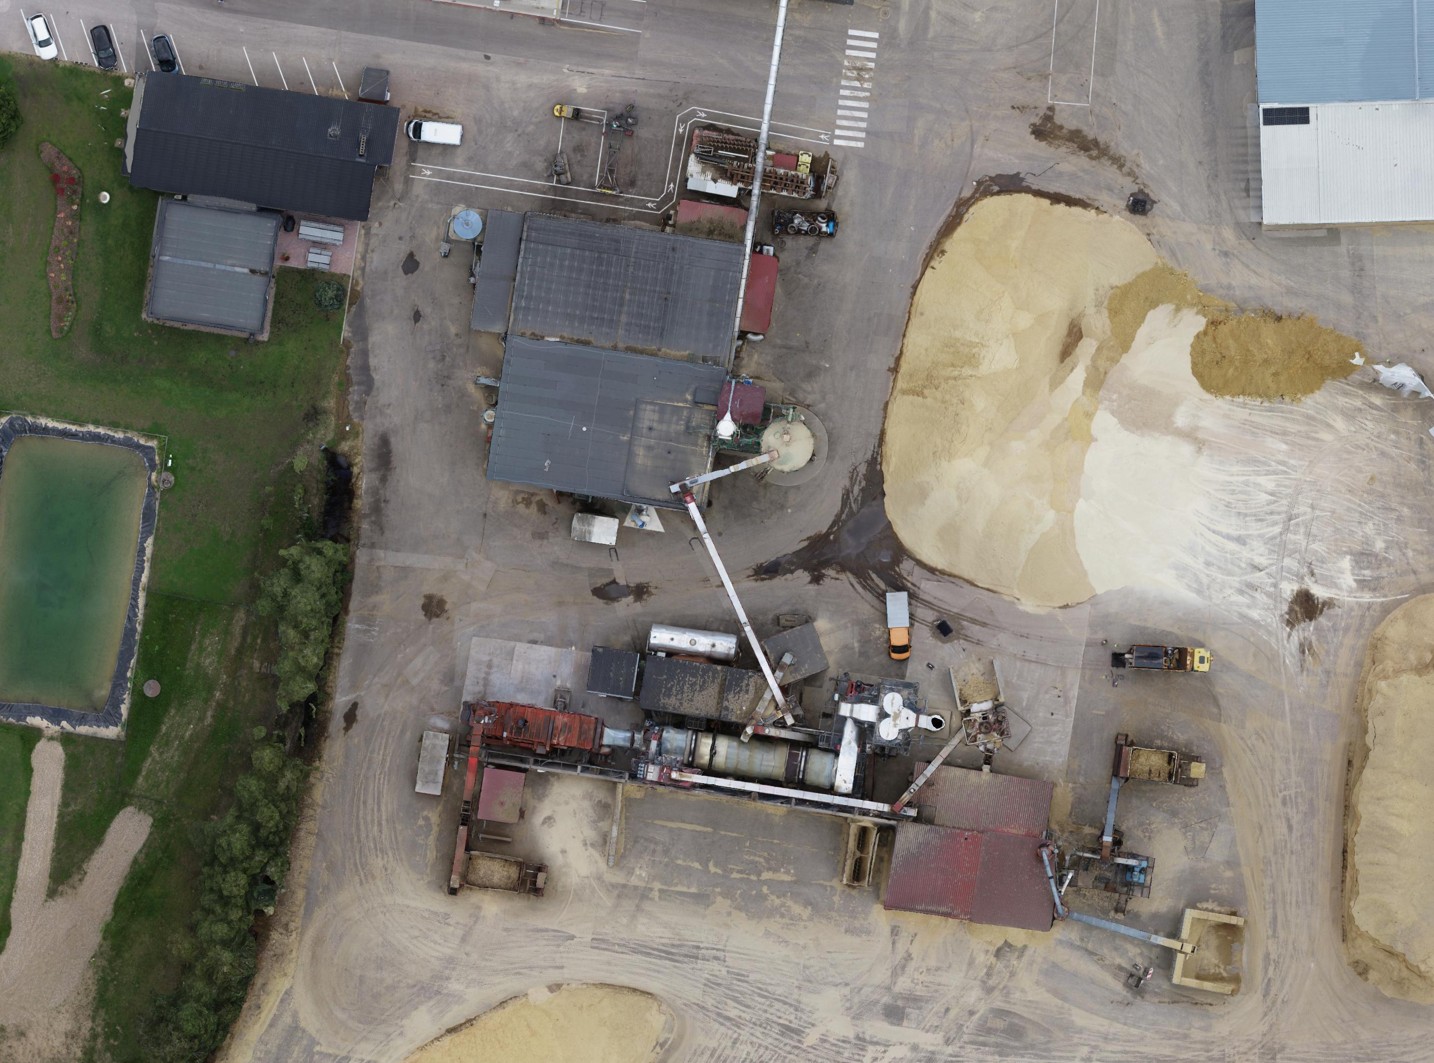
Mining & Aggregates. We survey open-pit mines and sand & gravel quarries, including benches, haul roads, and stockyards. Deliverables include per-pile volumes, site totals, and cut/fill by phase or area — ready for reconciliation, contracts, and project controls.
Bathymetric Integration. Where water is present, we add single-beam bathymetric surveys to compute accurate underwater quantities for pits, ponds, and lagoons. Hydro data are merged with LiDAR/photogrammetry along shorelines and referenced to the same control, producing defensible dredge volumes, capacity curves, and cross-sections.
Volumetric Methods: LiDAR vs Photogrammetry vs GPS
Choosing the right method for stockpile and earthwork volumes.
| Capability | UAV LiDAR | UAV Photogrammetry | Hendheld SLAM |
|---|---|---|---|
| Accuracy | ±1–3% | ±2–5% | ±1–2% |
| Throughput | Very high | High | Very high |
| Vegetation penetration | Excellent | Limited | Limited |
| Bathymetric integration | Yes | No | Yes |
| Best fit for | Mixed sites, vegetation | Open sites | Open sites, Indoors |
More: Stockpile Volumetrics: LiDAR vs Photogrammetry vs GPS.
See real deliverables
Open our Sample Data Portal — preview orthophotos, point clouds & 3D tiles in your browser.
Aggregate Quarry Volumetrics
Monthly UAV LiDAR volumetric survey of an aggregate quarry — per-pile volumes, cut/fill heatmaps, and reconciliation reports.
View all projects*Assumes good control, surface visibility, well-defined toes/breaklines; underwater quantities referenced to site water/vertical datum.
Deliverables
 Volume Reports
- Total and net volumes (cut/fill)
- Per-pile and per-phase breakdowns
- Assumptions, dates, and control summary
 Maps & Visuals
- Colorized cut/fill heatmaps
- Toes and breaklines, pile IDs
- Section plots and spot checks
 Data Formats
Methods
 Stockpiles
- Toe digitization and breakline enforcement
- Best-fit base plane or known floor level
- Occlusion checks and edge refinement
 Cut/Fill
- Surface-to-surface (existing vs. design)
- Interval progress against baseline
- Grid/sectional summaries by area
 QA Comparisons
- Check lines/points and residuals
- Alternative method cross-checks
- Variance flags and reason codes
Workflow
- Scope & references — design/baseline and naming conventions
- Control & safety — site control, access, and traffic planning
- Acquisition — UAV/mobile LiDAR or imagery
- Processing — classification, breaklines, and surface build
- Computation — toeing, base, and cut/fill calculations
- QA/QC — checks, exceptions, and variance commentary
- Handover — reports, data packages, and dashboards
Technology
 Sensors & Survey
- UAV/mobile LiDAR; high-res RGB
- GNSS RTK/PPK and total station checks
- SLAM for GNSS-challenged areas
Computation Methods
Standards & QA
 QA/QC
QA/QC
- Control summary and calibration notes
- Check lines/points and residual stats
- Repeatability and method comparison
 Documentation
- Assumptions, base definitions, and dates
- Change log and versioning for audits
- Signed deliverables upon request
 Presentation
- Colorized cut/fill maps and callouts
- Pile labels and sections
- Area-based breakdowns and charts
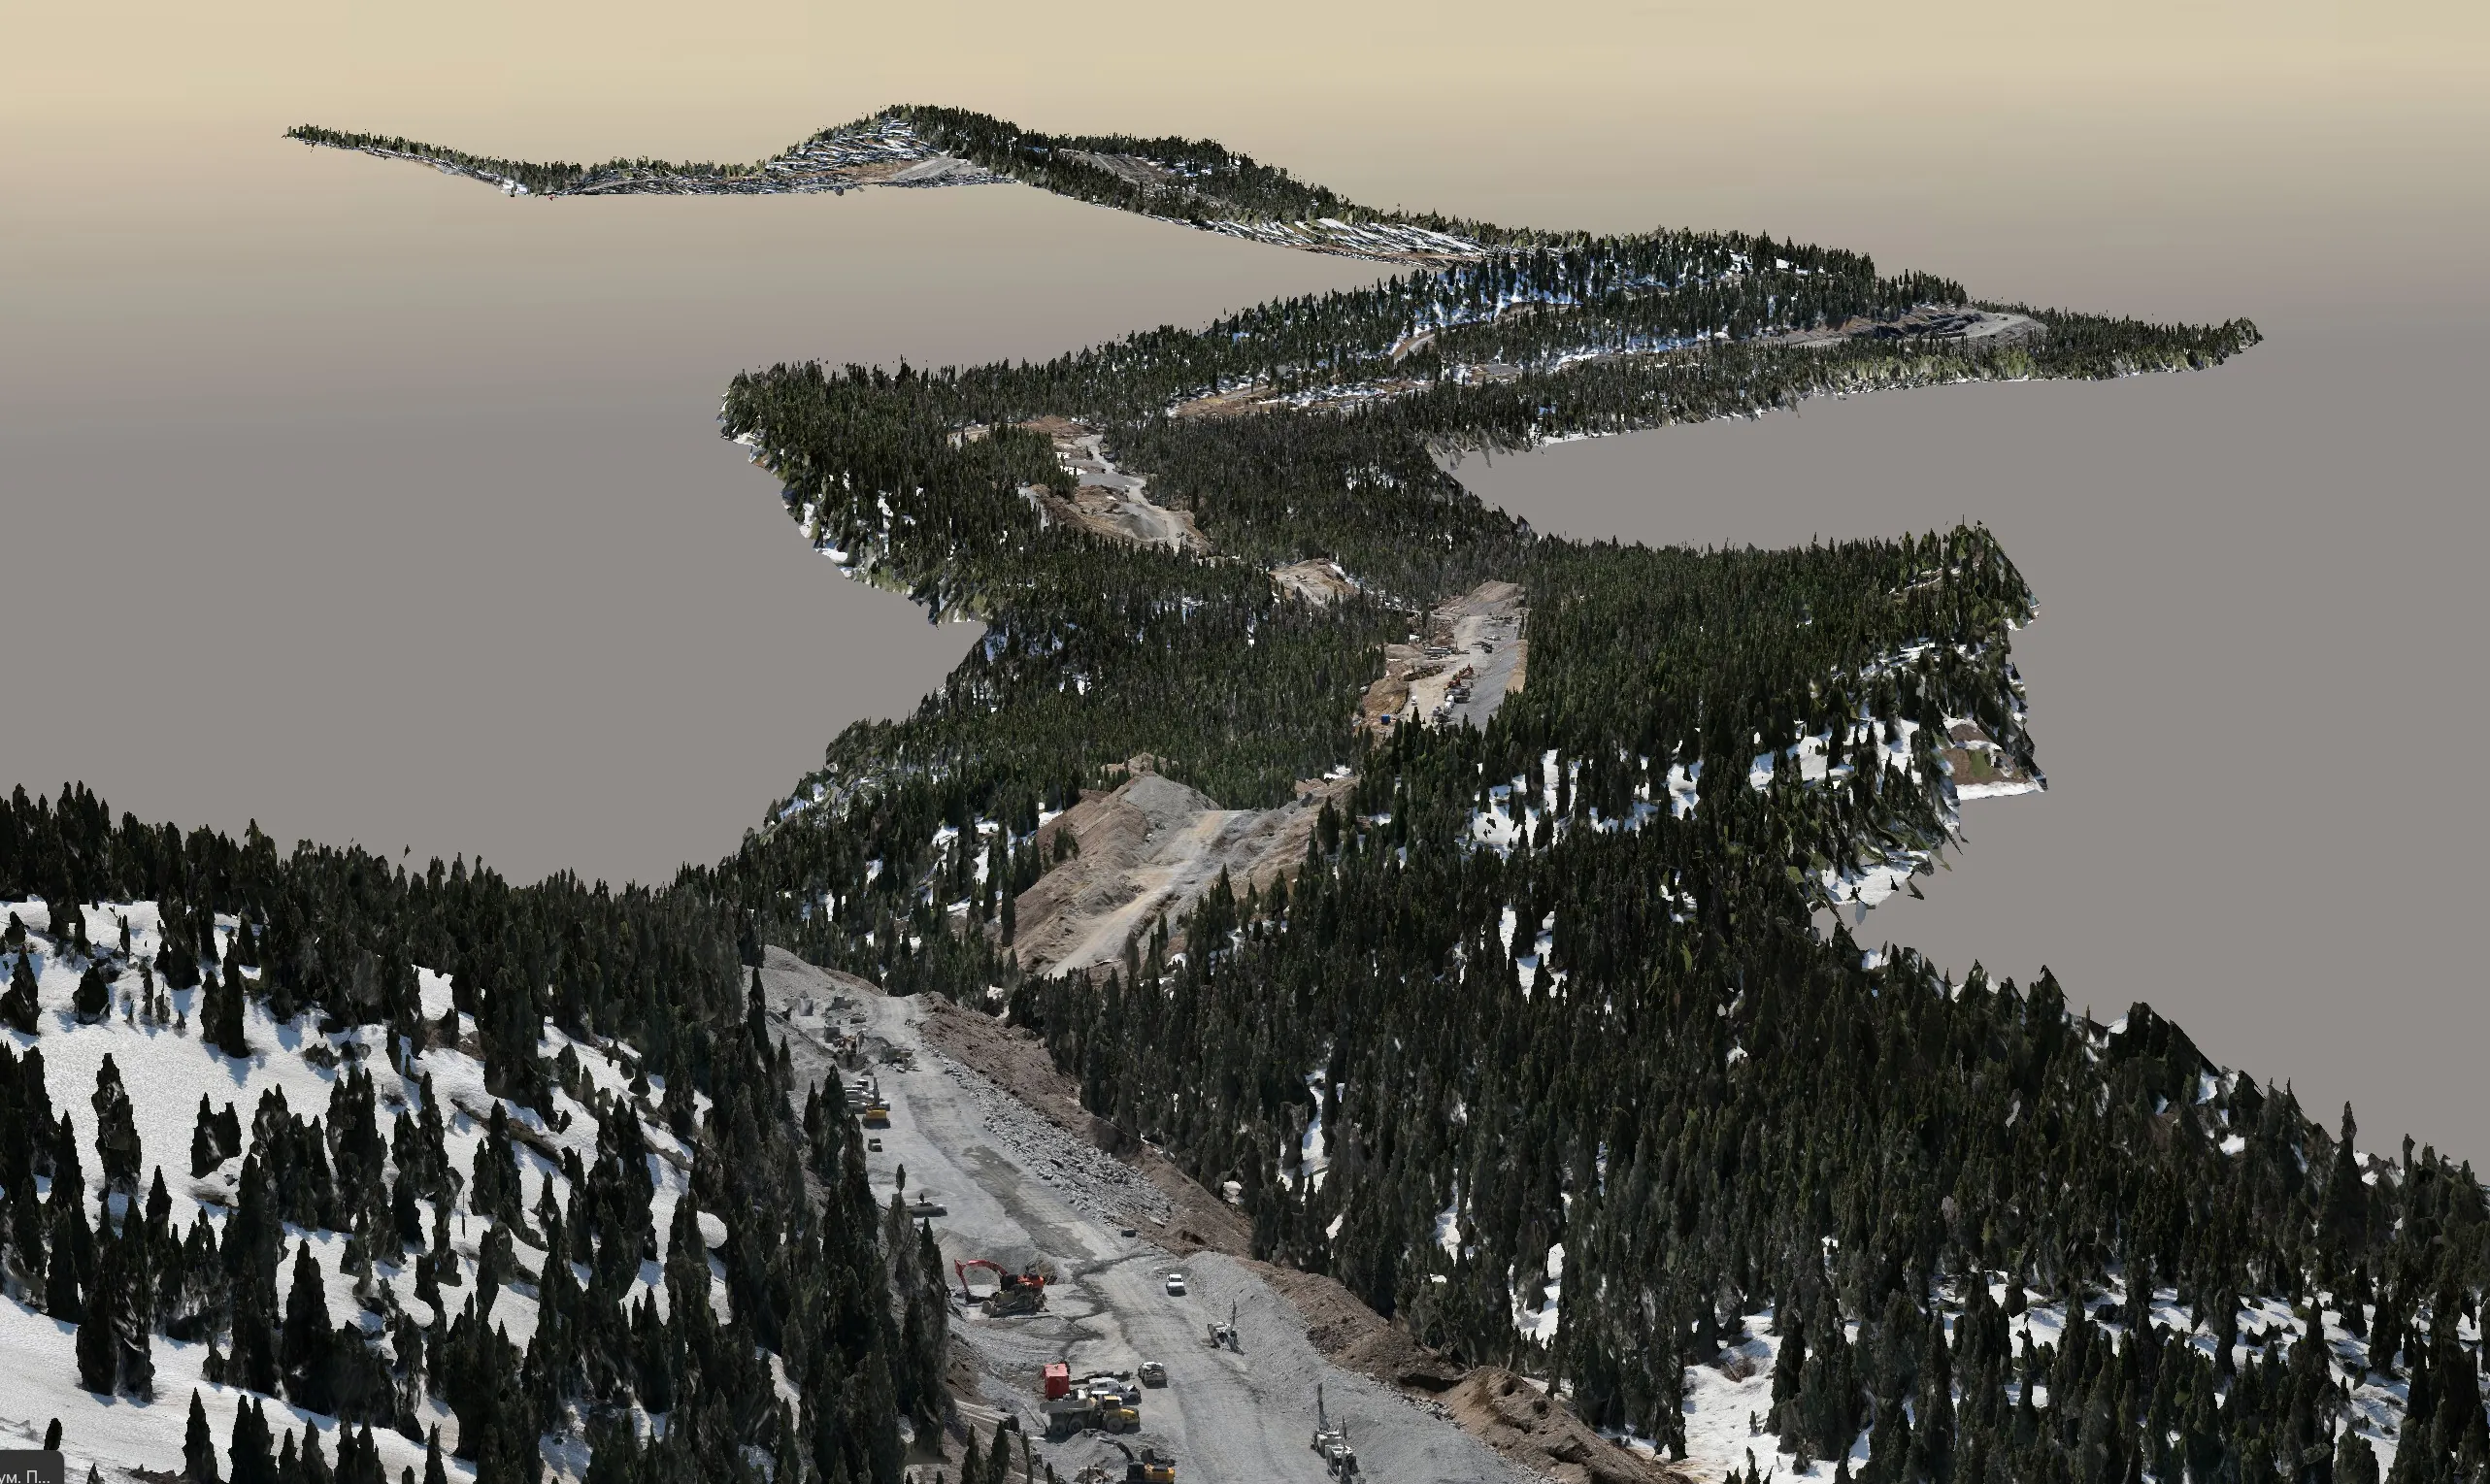
- 3D mesh model
FAQ
Need certified volumes or cut/fill tracking?
Reconciliation-ready reports and cut/fill heatmaps for stockpiles, mines, quarries, and earthworks.